
1 Pages (19 items)
What's wrong? SMath or my fundamentals? - Messages
#1 Posted: 5/27/2026 12:29:22 PM

Hello,
My calculations involve a measurement setup designed to measure capacitors with small inductances. Multimeters typically cannot measure in the pF range. This requires a resistor with a known resistance value (as close as possible), a signal generator (possibly using software and a sound card), and a 2-channel oscilloscope. Not only must two amplitudes be measured, but also the phase difference between the two signals.
The calculation works quite well with a sine wave. However, the results for the calculated inductances vary more than I had hoped.
Problem in this program: Why doesn’t Draw2D produce a graph when there is an arg() statement in the last key? If it is replaced, for example, by a -Re()- statement, then Draw3D generates a graph?!
Now I had hoped to be able to perform calculations using the determined complex transfer function even when the input is a square wave instead of a sine wave. Unfortunately, that doesn’t work. Why?
Regards, Andreas
Versuch mit R und C Sinus 01.pdf (2.19 MiB) downloaded 375 time(s). Versuch mit R und C Sinus 01.sm (814.63 KiB) downloaded 498 time(s).
Versuch mit R und C Rechteck 01.pdf (1.86 MiB) downloaded 391 time(s). Versuch mit R und C Rechteck 01.sm (555.42 KiB) downloaded 494 time(s).
My calculations involve a measurement setup designed to measure capacitors with small inductances. Multimeters typically cannot measure in the pF range. This requires a resistor with a known resistance value (as close as possible), a signal generator (possibly using software and a sound card), and a 2-channel oscilloscope. Not only must two amplitudes be measured, but also the phase difference between the two signals.
The calculation works quite well with a sine wave. However, the results for the calculated inductances vary more than I had hoped.
Problem in this program: Why doesn’t Draw2D produce a graph when there is an arg() statement in the last key? If it is replaced, for example, by a -Re()- statement, then Draw3D generates a graph?!
Now I had hoped to be able to perform calculations using the determined complex transfer function even when the input is a square wave instead of a sine wave. Unfortunately, that doesn’t work. Why?
Regards, Andreas
Versuch mit R und C Sinus 01.pdf (2.19 MiB) downloaded 375 time(s). Versuch mit R und C Sinus 01.sm (814.63 KiB) downloaded 498 time(s).
Versuch mit R und C Rechteck 01.pdf (1.86 MiB) downloaded 391 time(s). Versuch mit R und C Rechteck 01.sm (555.42 KiB) downloaded 494 time(s).
Edited 5/27/2026 12:32:09 PM
#2 Posted: 5/28/2026 5:43:35 AM
Hi. I hope these results can help you with your analysis. The circuit is solved numerically using the spice# plugin and symbolically using the MNA method. For more information, see https://smath.com/en-US/forum/topic/HhT3PC/SpiceSharp
Versuch mit R und C MNA.pdf (483.77 KiB) downloaded 359 time(s).
Versuch mit R und C MNA.sm (703.09 KiB) downloaded 482 time(s).
Best regards.
Alvaro.
Versuch mit R und C MNA.pdf (483.77 KiB) downloaded 359 time(s).
Versuch mit R und C MNA.sm (703.09 KiB) downloaded 482 time(s).
Best regards.
Alvaro.
#3 Posted: 5/28/2026 6:02:25 AM
Hi Alvaro,
Thanks for your help. For one thing, I didn't even know there was a Spice plug-in. For another, I need to familiarize myself with how you use SMath first. That will probably take a few days. For problems I couldn't solve using SMath the way I do, I've always switched to Octave so far.
Best regards
Thanks for your help. For one thing, I didn't even know there was a Spice plug-in. For another, I need to familiarize myself with how you use SMath first. That will probably take a few days. For problems I couldn't solve using SMath the way I do, I've always switched to Octave so far.
Best regards
#4 Posted: 5/29/2026 9:57:27 PM
This is the simulation in LTSpice using only the netlist, and it apparently gives the same results in SMath's spice# plugin. Is this netlist correct?
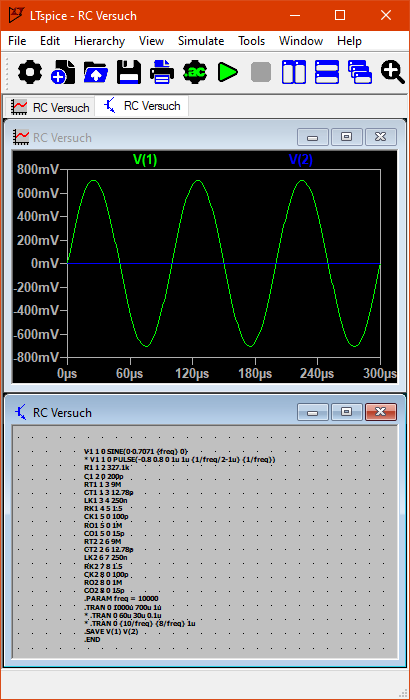
Best regards.
Alvaro.
V1 1 0 SINE(0 0.7071 {freq} 0)
* V1 1 0 PULSE(-0.8 0.8 0 1u 1u {1/freq/2-1u} {1/freq})
R1 1 2 327.1k
C1 2 0 200p
RT1 1 3 9M
CT1 1 3 12.78p
LK1 3 4 250n
RK1 4 5 1.5
CK1 5 0 100p
RO1 5 0 1M
CO1 5 0 15p
RT2 2 6 9M
CT2 2 6 12.78p
LK2 6 7 250n
RK2 7 8 1.5
CK2 8 0 100p
RO2 8 0 1M
CO2 8 0 15p
.PARAM freq = 10000
.TRAN 0 1000u 700u 1u
* .TRAN 0 60u 30u 0.1u
* .TRAN 0 {10/freq} {8/freq} 1u
.SAVE V(1) V(2)
.END
Best regards.
Alvaro.
#5 Posted: 5/30/2026 4:56:59 PM
Hi Alvaro,
I haven't had a chance to try out the SMath SPICE plugin yet.
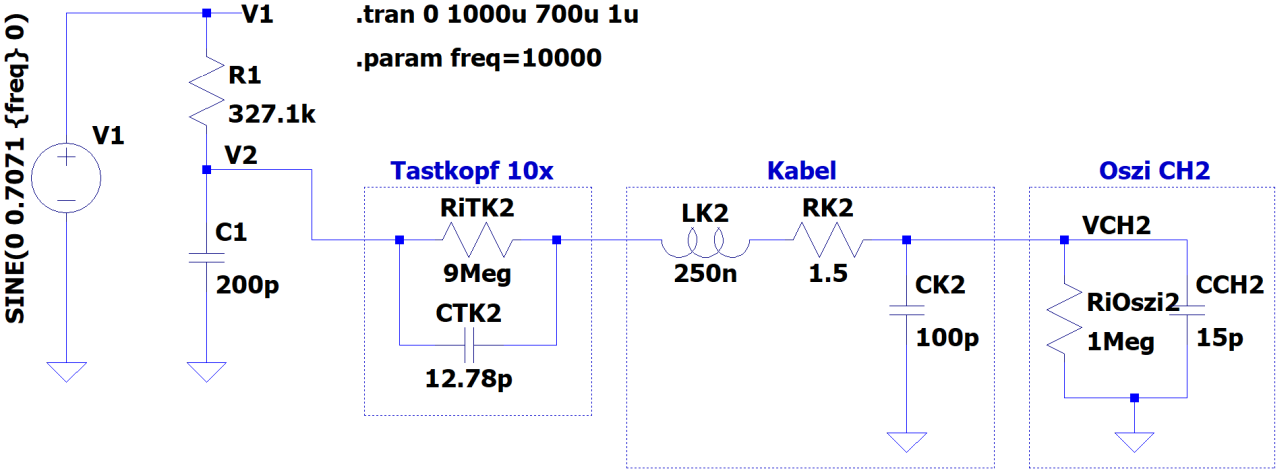
In my LTspice schematic, CH1 has no function. The only important part is what you can see in the attached schematic. I've also included the exported netlist.
In Smath, I mainly wanted to work with complex transfer functions. It worked quite well with a sine wave as input. I thought that the transfer function generated this way would also produce meaningful results with a square wave as input. Unfortunately, that’s not the case. I’d now like to know why not.
Best regards
Andreas
 Versuch mit R und C Sinus 03.net (564 B) downloaded 537 time(s).
I haven't had a chance to try out the SMath SPICE plugin yet.
In my LTspice schematic, CH1 has no function. The only important part is what you can see in the attached schematic. I've also included the exported netlist.
In Smath, I mainly wanted to work with complex transfer functions. It worked quite well with a sine wave as input. I thought that the transfer function generated this way would also produce meaningful results with a square wave as input. Unfortunately, that’s not the case. I’d now like to know why not.
Best regards
Andreas
Versuch mit R und C Sinus 03.net (564 B) downloaded 537 time(s).Edited 5/30/2026 4:57:27 PM
#6 Posted: 6/2/2026 9:02:44 AM
Hi. I can't find any errors in your method; however, because it's so slow, it's difficult for me to study it in detail. One observation is that the phasor method only returns the steady-state solution, and the transient response might be what's causing the discrepancy. You can observe the same situation in the sinusoidal waveform solution.
Versuch mit R und C V4.sm (442.88 KiB) downloaded 468 time(s).
Versuch mit R und C MNA.pdf (1016.18 KiB) downloaded 374 time(s).
Best regards.
Alvaro.
Versuch mit R und C V4.sm (442.88 KiB) downloaded 468 time(s).
Versuch mit R und C MNA.pdf (1016.18 KiB) downloaded 374 time(s).
Best regards.
Alvaro.
#7 Posted: 6/3/2026 6:22:44 AM
Hi Alvaro,
Since I'm not interested in the transient phase, I omit the first few oscillations from the simulation. “.tran 0 1000u 700u 1u” shows me only the 8th, 9th, and 10th oscillations.
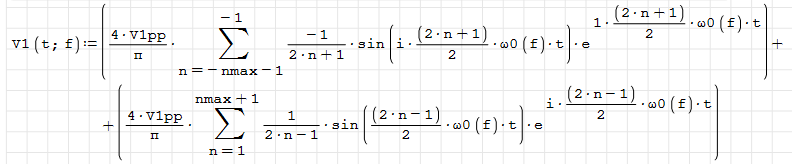
With the integration used to calculate the coefficients “c(n;f)” for the square-wave oscillation, the calculation takes a very long time. There’s a faster way:
V1(t,f) {4*V1pp}/π*sum({-1}/{2*n+1}*sin(i*(2*n+1)/2*ω0(f)*t)*e^{1*(2*n+1)/2*ω0(f)*t},n,-nmax-1,-1))+({4*V1pp}/π*sum(1/{2*n-1}*sin((2*n-1)/2*ω0(f)*t)*e^{i*(2*n-1)/2*ω0(f)*t},n,1,nmax+1))
I see you’ve really delved into the Laplace transform. As an engineer, I don’t want to get into the theory behind it—I just want to apply it to my problem. Unfortunately, that doesn’t always work, so I end up having to grapple with the fundamentals after all.
I’m still having trouble with your solution to my problem. But I’m working on it.
Best regards
Andreas
Since I'm not interested in the transient phase, I omit the first few oscillations from the simulation. “.tran 0 1000u 700u 1u” shows me only the 8th, 9th, and 10th oscillations.
With the integration used to calculate the coefficients “c(n;f)” for the square-wave oscillation, the calculation takes a very long time. There’s a faster way:
V1(t,f)
{4*V1pp}/π*sum({-1}/{2*n+1}*sin(i*(2*n+1)/2*ω0(f)*t)*e^{1*(2*n+1)/2*ω0(f)*t},n,-nmax-1,-1))+({4*V1pp}/π*sum(1/{2*n-1}*sin((2*n-1)/2*ω0(f)*t)*e^{i*(2*n-1)/2*ω0(f)*t},n,1,nmax+1))I see you’ve really delved into the Laplace transform. As an engineer, I don’t want to get into the theory behind it—I just want to apply it to my problem. Unfortunately, that doesn’t always work, so I end up having to grapple with the fundamentals after all.
I’m still having trouble with your solution to my problem. But I’m working on it.
Best regards
Andreas
#8 Posted: 6/5/2026 12:50:19 AM
Hi Andreas. The solution for a square wave, using superposition method and admittance matrix.
Versuch mit R und C sqare.sm (30.43 KiB) downloaded 433 time(s).
Versuch mit R und C sqare.pdf (544.96 KiB) downloaded 395 time(s).
Best regards.
Alvaro
Versuch mit R und C sqare.sm (30.43 KiB) downloaded 433 time(s).
Versuch mit R und C sqare.pdf (544.96 KiB) downloaded 395 time(s).
Best regards.
Alvaro
#9 Posted: 6/8/2026 11:48:08 AM
Hi Alvaro,
this morning I took a few more measurements. I’m still using capacitors whose capacitance I know. My goal is to determine capacitances between 10 pF and 0.1 pF.
That reminded me again why I wanted to calculate with complex transfer functions in Smath.
I’ve gotten pretty good at using LTspice by now. But in LTspice, I have to specify the component values myself. I’ve also imported measured pulses into LTspice and then tried varying the specified values until the simulation output resembled the measured output. That’s tedious work.
For a sine wave, I managed to use SMath to reverse the formulas and calculate the component values (especially those of C1) from the measured values. That’s exactly what I wanted to achieve for a square wave as well.
Gegards Andreas
this morning I took a few more measurements. I’m still using capacitors whose capacitance I know. My goal is to determine capacitances between 10 pF and 0.1 pF.
That reminded me again why I wanted to calculate with complex transfer functions in Smath.
I’ve gotten pretty good at using LTspice by now. But in LTspice, I have to specify the component values myself. I’ve also imported measured pulses into LTspice and then tried varying the specified values until the simulation output resembled the measured output. That’s tedious work.
For a sine wave, I managed to use SMath to reverse the formulas and calculate the component values (especially those of C1) from the measured values. That’s exactly what I wanted to achieve for a square wave as well.
Gegards Andreas
#10 Posted: 6/8/2026 10:03:33 PM
Hi Andreas. What the previous worksheets show is how to use the superposition principle once you have the frequency-domain expression for the circuit. The MNA function finds it, or you can find it by hand.
In the case of this circuit, the symbolic expression for v2 is
-{RT*(s*LK*(((RT*(1+s^2*CT*LK)+s*LK)*(RT+R1*(1+s*RT*(CT+C1)))-(1+s*CT *RT)^2*R1*s*LK)*RO+R1*(1+s*CT*RT)^2*(-(RO+RK*(1+s*RO*(CO+CK)))*(RK+s*L K)+RO*s*LK))-(RO+RK*(1+s*RO*(CO+CK)))*(-(RT+R1*(1+s*RT*(CT+C1)))*RK*RT +(RK+s*LK)*((RT*(1+s^2*CT*LK)+s*LK)*(RT+R1*(1+s*RT*(CT+C1)))-(1+s*CT*R T)^2*R1*s*LK)))*V1*e^{s*t}}/{(RT+R1*(1+s*RT*(CT+C1)))*(-((RT*(1+s^2*CT) *LK)+s*LK)*(RT+R1*(1+s*RT*(CT+C1)))-(1+s*CT*RT)^2*R1*s*LK)*RO*s*LK+(RO +RK*(1+s*RO*(CO+CK)))*(-(RT+R1*(1+s*RT*(CT+C1)))*RK*RT+(RK+s*LK)*((RT* (1+s^2*CT*LK)+s*LK)*(RT+R1*(1+s*RT*(CT+C1)))-(1+s*CT*RT)^2*R1*s*LK)))}
where V1 is the Laplace transform of the input voltage, which for a square wave is -i*{4*Vo}/{(2*k-1)*π}
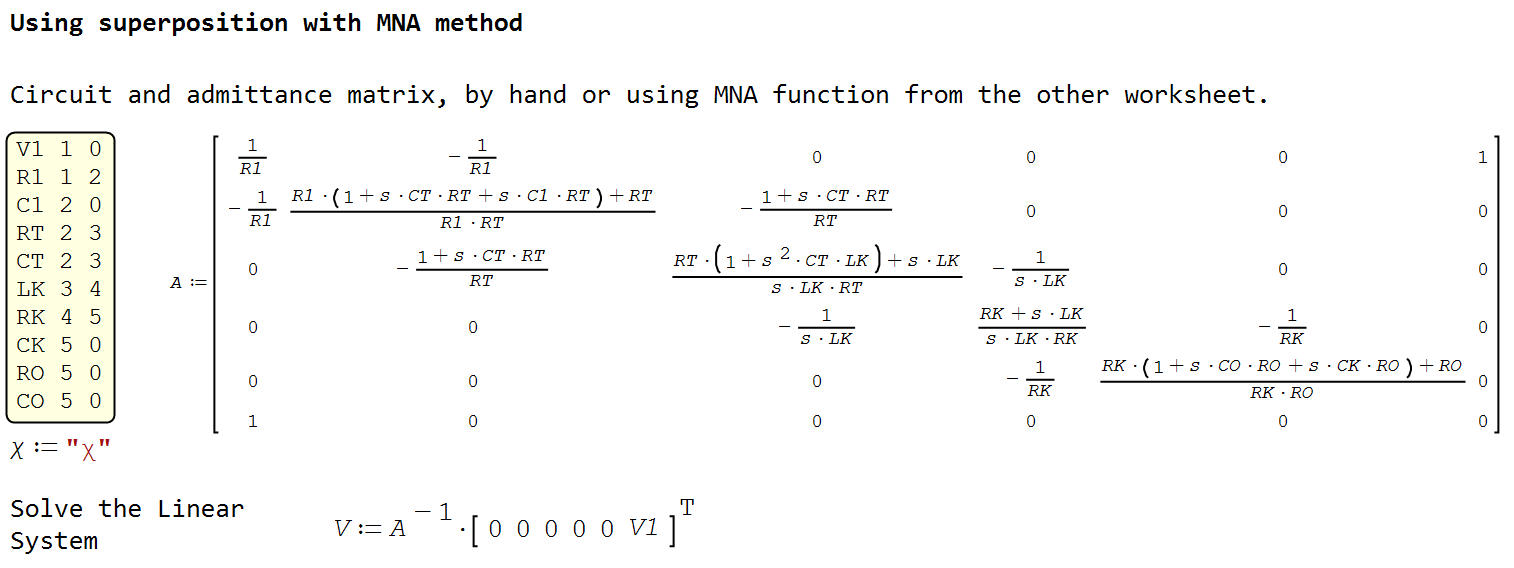
The expression may seem very complicated, but only because it derives from inverting the circuit's admittance matrix, which is simpler to understand. What calculations have you planned by varying C1?
Best regards.
Alvaro.
In the case of this circuit, the symbolic expression for v2 is
-{RT*(s*LK*(((RT*(1+s^2*CT*LK)+s*LK)*(RT+R1*(1+s*RT*(CT+C1)))-(1+s*CT *RT)^2*R1*s*LK)*RO+R1*(1+s*CT*RT)^2*(-(RO+RK*(1+s*RO*(CO+CK)))*(RK+s*L K)+RO*s*LK))-(RO+RK*(1+s*RO*(CO+CK)))*(-(RT+R1*(1+s*RT*(CT+C1)))*RK*RT +(RK+s*LK)*((RT*(1+s^2*CT*LK)+s*LK)*(RT+R1*(1+s*RT*(CT+C1)))-(1+s*CT*R T)^2*R1*s*LK)))*V1*e^{s*t}}/{(RT+R1*(1+s*RT*(CT+C1)))*(-((RT*(1+s^2*CT) *LK)+s*LK)*(RT+R1*(1+s*RT*(CT+C1)))-(1+s*CT*RT)^2*R1*s*LK)*RO*s*LK+(RO +RK*(1+s*RO*(CO+CK)))*(-(RT+R1*(1+s*RT*(CT+C1)))*RK*RT+(RK+s*LK)*((RT* (1+s^2*CT*LK)+s*LK)*(RT+R1*(1+s*RT*(CT+C1)))-(1+s*CT*RT)^2*R1*s*LK)))}
where V1 is the Laplace transform of the input voltage, which for a square wave is -i*{4*Vo}/{(2*k-1)*π}
The expression may seem very complicated, but only because it derives from inverting the circuit's admittance matrix, which is simpler to understand. What calculations have you planned by varying C1?
Best regards.
Alvaro.
#11 Posted: 6/9/2026 6:41:00 AM
Hi Alvaro,
It’s been a very long time since I’ve worked with matrices of functions, so I’ll need to get back into the swing of things.
For the LTspice simulation of an entire system, I need more precise values for individual components. For example, for the RG58 cables and the photomultiplier (PMT). The PMT manufacturer recommends using a current source (not a voltage source) to simulate the anode signal, along with a resistor greater than 1 teraohm and a capacitance less than 10 pF. However, to get my simulation results closer to the measured pulses, I need to choose a capacitance that is less than 1 pF.
In the meantime, I’ve conducted a series of measurements using different frequencies of the sine wave. I think a frequency should be chosen where the phase is close to 45°.
Regards Andreas
Versuch mit R und C.pdf (214.2 KiB) downloaded 285 time(s).
It’s been a very long time since I’ve worked with matrices of functions, so I’ll need to get back into the swing of things.
For the LTspice simulation of an entire system, I need more precise values for individual components. For example, for the RG58 cables and the photomultiplier (PMT). The PMT manufacturer recommends using a current source (not a voltage source) to simulate the anode signal, along with a resistor greater than 1 teraohm and a capacitance less than 10 pF. However, to get my simulation results closer to the measured pulses, I need to choose a capacitance that is less than 1 pF.
In the meantime, I’ve conducted a series of measurements using different frequencies of the sine wave. I think a frequency should be chosen where the phase is close to 45°.
Regards Andreas
Versuch mit R und C.pdf (214.2 KiB) downloaded 285 time(s).
#12 Posted: 6/12/2026 4:02:11 AM
Hi Alvaro,
I’ve never worked symbolically in SMath before. Using your SMath file, I’ve now had my first experience with it. I’ve also started working with MNT for the first time.
What I haven’t managed to do, and what I can’t figure out from your file either: How do I use symbolic results to continue my mathematical calculations?
And: How do I manipulate the symbolic results so that I can use my measurement results to calculate the capacitance of the capacitor?
Regards Andreas
Versuch mit R und C Sinus nach Alvaro.sm (524.33 KiB) downloaded 414 time(s).
I’ve never worked symbolically in SMath before. Using your SMath file, I’ve now had my first experience with it. I’ve also started working with MNT for the first time.
What I haven’t managed to do, and what I can’t figure out from your file either: How do I use symbolic results to continue my mathematical calculations?
And: How do I manipulate the symbolic results so that I can use my measurement results to calculate the capacitance of the capacitor?
Regards Andreas
Versuch mit R und C Sinus nach Alvaro.sm (524.33 KiB) downloaded 414 time(s).
#13 Posted: 6/12/2026 7:34:32 AM
Hi Andreas. SMath's symbolic functionalities are somewhat limited; however, it does allow for several manipulations. I've attached some examples of how to perform electrical measurements in the case of a square wave.
Versuch mit R und C sqare measures.sm (78.34 KiB) downloaded 445 time(s).
Versuch mit R und C sqare measures.pdf (706.69 KiB) downloaded 328 time(s).
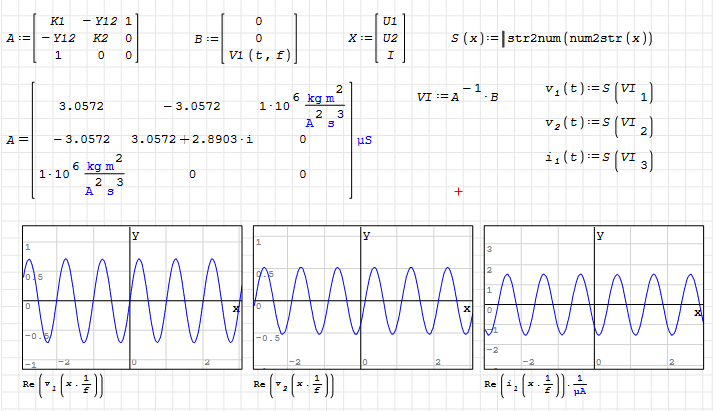
Regarding the file you attached, you can't simply invert a matrix with numerical admittances, as it contains mixed units of electrical potential and current. However, you can use the S function, which, in the absence of a function that simplifies expressions, can be useful in several cases, and this is one of them.
Versuch mit R und C Sinus nach Alvaro.sm (501.94 KiB) downloaded 453 time(s).
However, the V1 that appears in column vector B must be in the frequency domain, that is, it must be the Laplace transform of v1(t) (I follow the convention that lowercase letters are for functions in the time domain and uppercase letters for transforms or constant values). The correct expressions for v1, v2, and i1 would be obtained by inverting the expressions in VI, that is, v1(t) = invlaplace(v[1],s,t). Sometimes Maple can do this; otherwise, you can use the numerical inversion function.
Another way is to use the superposition of solutions in linear systems, which is what I applied in the previous examples. That's where the summations come from.
Another option would be to use FFT to solve the circuit numerically. If you're interested, I can show you how.
Best regards.
Alvaro.
Versuch mit R und C sqare measures.sm (78.34 KiB) downloaded 445 time(s).
Versuch mit R und C sqare measures.pdf (706.69 KiB) downloaded 328 time(s).
Regarding the file you attached, you can't simply invert a matrix with numerical admittances, as it contains mixed units of electrical potential and current. However, you can use the S function, which, in the absence of a function that simplifies expressions, can be useful in several cases, and this is one of them.
Versuch mit R und C Sinus nach Alvaro.sm (501.94 KiB) downloaded 453 time(s).
However, the V1 that appears in column vector B must be in the frequency domain, that is, it must be the Laplace transform of v1(t) (I follow the convention that lowercase letters are for functions in the time domain and uppercase letters for transforms or constant values). The correct expressions for v1, v2, and i1 would be obtained by inverting the expressions in VI, that is, v1(t) = invlaplace(v[1],s,t). Sometimes Maple can do this; otherwise, you can use the numerical inversion function.
Another way is to use the superposition of solutions in linear systems, which is what I applied in the previous examples. That's where the summations come from.
Another option would be to use FFT to solve the circuit numerically. If you're interested, I can show you how.
Best regards.
Alvaro.
#14 Posted: 6/14/2026 5:48:50 AM
hi,
Here is another comparison of simulation and calculation using a complex transfer function.
I find it alarming just how much the measurement equipment (oscilloscope and 10x probe) distorts the signal.
Regards Andreas
Versuch mit R und C Sinus Berechnung.pdf (1.31 MiB) downloaded 326 time(s). Versuch mit R und C Sinus Berechnung.sm (255.37 KiB) downloaded 405 time(s).
Here is another comparison of simulation and calculation using a complex transfer function.
I find it alarming just how much the measurement equipment (oscilloscope and 10x probe) distorts the signal.
Regards Andreas
Versuch mit R und C Sinus Berechnung.pdf (1.31 MiB) downloaded 326 time(s). Versuch mit R und C Sinus Berechnung.sm (255.37 KiB) downloaded 405 time(s).
#15 Posted: 6/17/2026 11:58:51 AM
Hi Alvaro,
I've been struggling with Smath for a few days now, but I still haven't been able to solve a couple of problems.
First of all: What does the “SN” function do, and why do I need it?
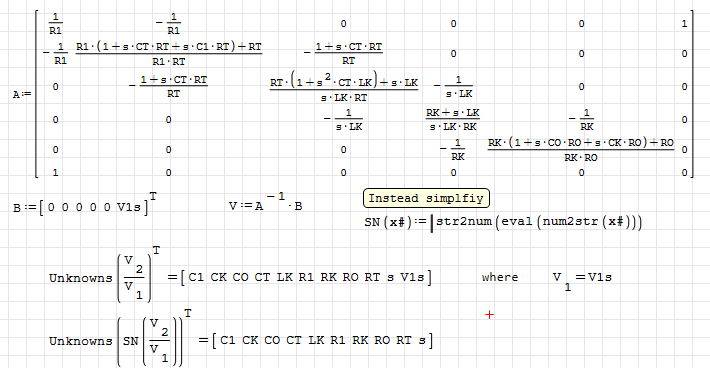
It’s not necessary for “V := SN(A^{-1}*B )” and “H(s,C1) := SN(el(V,2)/el(V,1))”—it works fine without it. However, it’s absolutely essential for “H.n(n):=SN(H(i*n*2*π*f,C1))”. Even though the symbolic output of “SN(H(i*n*2*π*f,C1))=” and “H(i*n*2*π*f,C1)=” looks identical to me?!
It also took me several hours to realize that I had to set the loop variable “κmax” for the definition of the sum function in order to avoid getting the error message “κmax – not defined.”
Regards Andreas
I've been struggling with Smath for a few days now, but I still haven't been able to solve a couple of problems.
First of all: What does the “SN” function do, and why do I need it?
It’s not necessary for “V := SN(A^{-1}*B )” and “H(s,C1) := SN(el(V,2)/el(V,1))”—it works fine without it. However, it’s absolutely essential for “H.n(n):=SN(H(i*n*2*π*f,C1))”. Even though the symbolic output of “SN(H(i*n*2*π*f,C1))=” and “H(i*n*2*π*f,C1)=” looks identical to me?!
It also took me several hours to realize that I had to set the loop variable “κmax” for the definition of the sum function in order to avoid getting the error message “κmax – not defined.”
Regards Andreas
Edited 6/17/2026 11:59:53 AM
#16 Posted: 6/18/2026 5:09:36 AM
Hi Andreas. SMath doesn't have a simplification function. I think I read about this method from Martin Kraska. SMath sometimes retains the internal operations, even though the evaluation shows the actual result. In this specific case, SN simplifies the expression by removing V1s from the numerator and denominator. Without using Maple or Maxima, I don't know if there's another way to remove V1s.
sn simplify.sm (13.03 KiB) downloaded 393 time(s).
Best regards.
Alvaro.
sn simplify.sm (13.03 KiB) downloaded 393 time(s).
Best regards.
Alvaro.
#17 Posted: 6/21/2026 9:25:27 AM
Hi Alvaro,
well, I’ve been struggling with this for a few more days now.
First, regarding the SN function:
It seems absolutely essential to me when two functions are divided by each other. This is particularly true when determining a transfer function, when Fout(t;s)/Fin(t;s) becomes H(s) — that is, when the dependence on “t” is canceled out. Unfortunately, with H(s) — which is actually an H(t;s) — you can continue calculating through several steps without error messages, only to receive an error message at the end.
Graph of V1, V2, and V12:
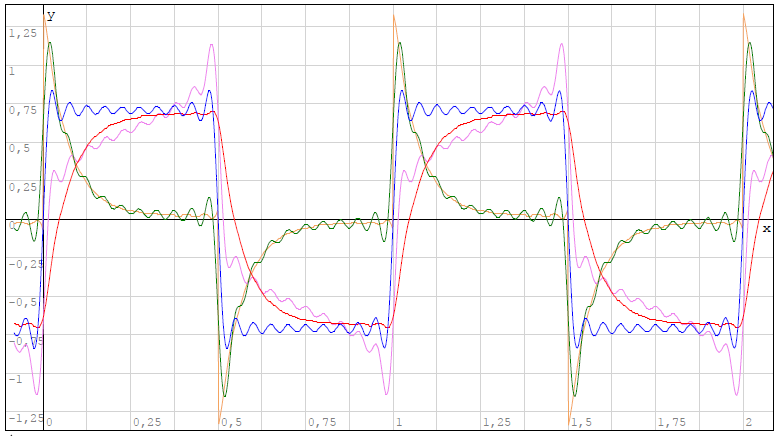
Your graph reproduces the results of my measurements and my simulation very well. But the red V2 curve wasn’t calculated using the blue V1 curve. The blue V1 curve was generated from a sign function, while V2 was calculated using a Fourier series. For the nice, smooth V12 function, the sign function was then also calculated using the result of the Fourier series. Actually, the graph looks just like the one in the attachment.
Calculation of the Transfer Function:
In very simple terms, the transfer function is calculated from V2/V1, and then multiplied by V1 again to calculate V2. Why isn’t the V2 function calculated at the end identical to the V2 function used to calculate the transfer function? When comparing the two V2 functions (magenta and red), it appears that some smoothing or filtering has taken place. Can’t this mechanism also be applied to the Fourier series V1 function to make it smoother?
Translated with DeepL.com (free version)
Regards Andreas
Versuch mit R und C sqare measures Andreas.pdf (788.22 KiB) downloaded 270 time(s).
Versuch mit R und C sqare measures Andreas.sm (119.64 KiB) downloaded 395 time(s).
well, I’ve been struggling with this for a few more days now.
First, regarding the SN function:
It seems absolutely essential to me when two functions are divided by each other. This is particularly true when determining a transfer function, when Fout(t;s)/Fin(t;s) becomes H(s) — that is, when the dependence on “t” is canceled out. Unfortunately, with H(s) — which is actually an H(t;s) — you can continue calculating through several steps without error messages, only to receive an error message at the end.
Graph of V1, V2, and V12:
Your graph reproduces the results of my measurements and my simulation very well. But the red V2 curve wasn’t calculated using the blue V1 curve. The blue V1 curve was generated from a sign function, while V2 was calculated using a Fourier series. For the nice, smooth V12 function, the sign function was then also calculated using the result of the Fourier series. Actually, the graph looks just like the one in the attachment.
Calculation of the Transfer Function:
In very simple terms, the transfer function is calculated from V2/V1, and then multiplied by V1 again to calculate V2. Why isn’t the V2 function calculated at the end identical to the V2 function used to calculate the transfer function? When comparing the two V2 functions (magenta and red), it appears that some smoothing or filtering has taken place. Can’t this mechanism also be applied to the Fourier series V1 function to make it smoother?
Translated with DeepL.com (free version)
Regards Andreas
Versuch mit R und C sqare measures Andreas.pdf (788.22 KiB) downloaded 270 time(s).
Versuch mit R und C sqare measures Andreas.sm (119.64 KiB) downloaded 395 time(s).
Edited 6/21/2026 9:31:21 AM
#18 Posted: 6/22/2026 5:01:34 AM
Hi Andreas
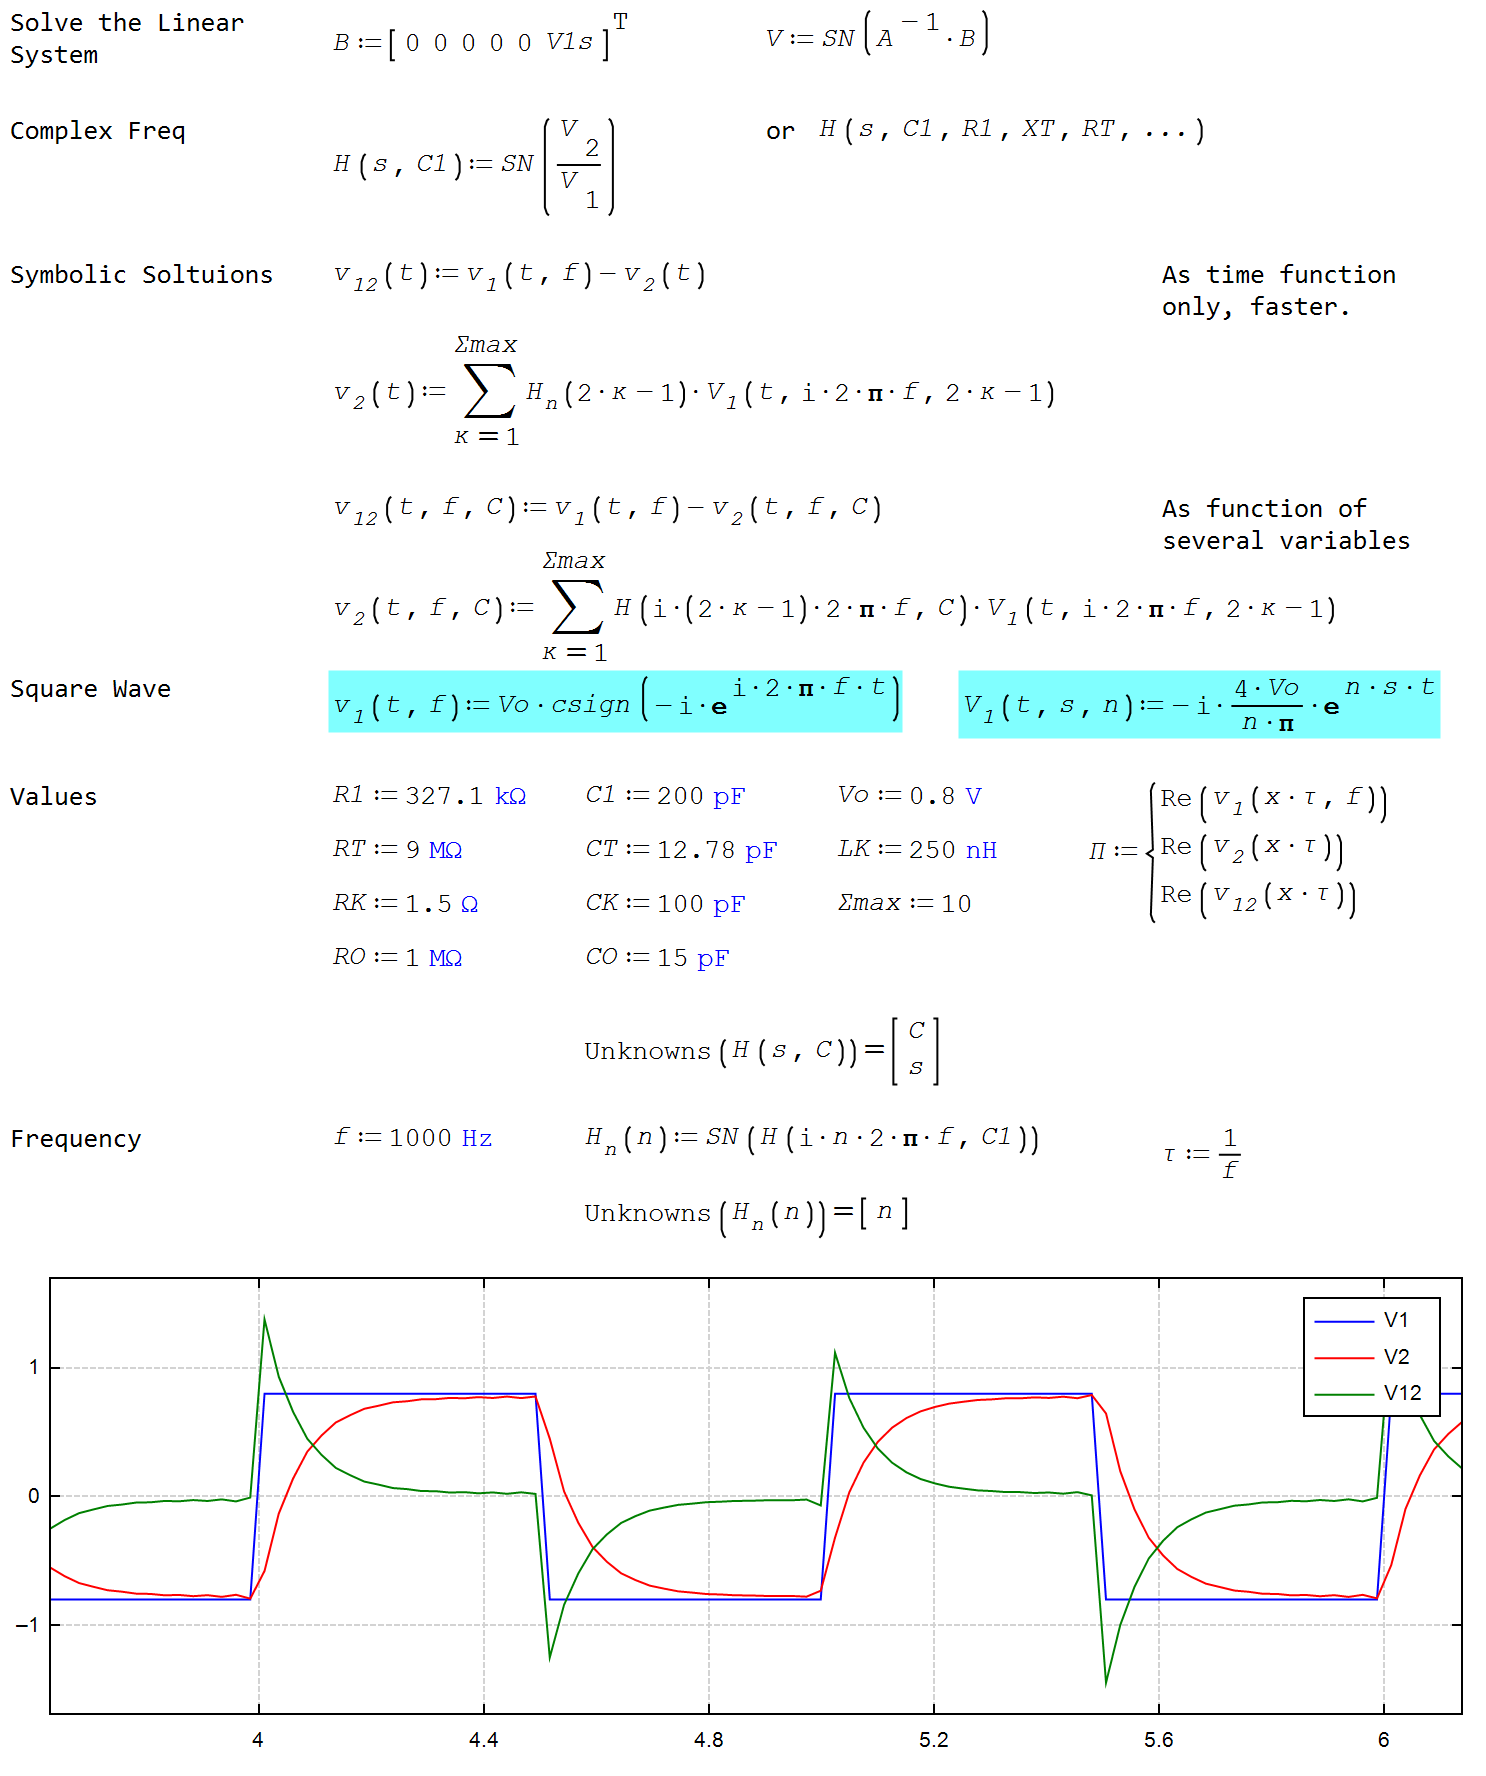
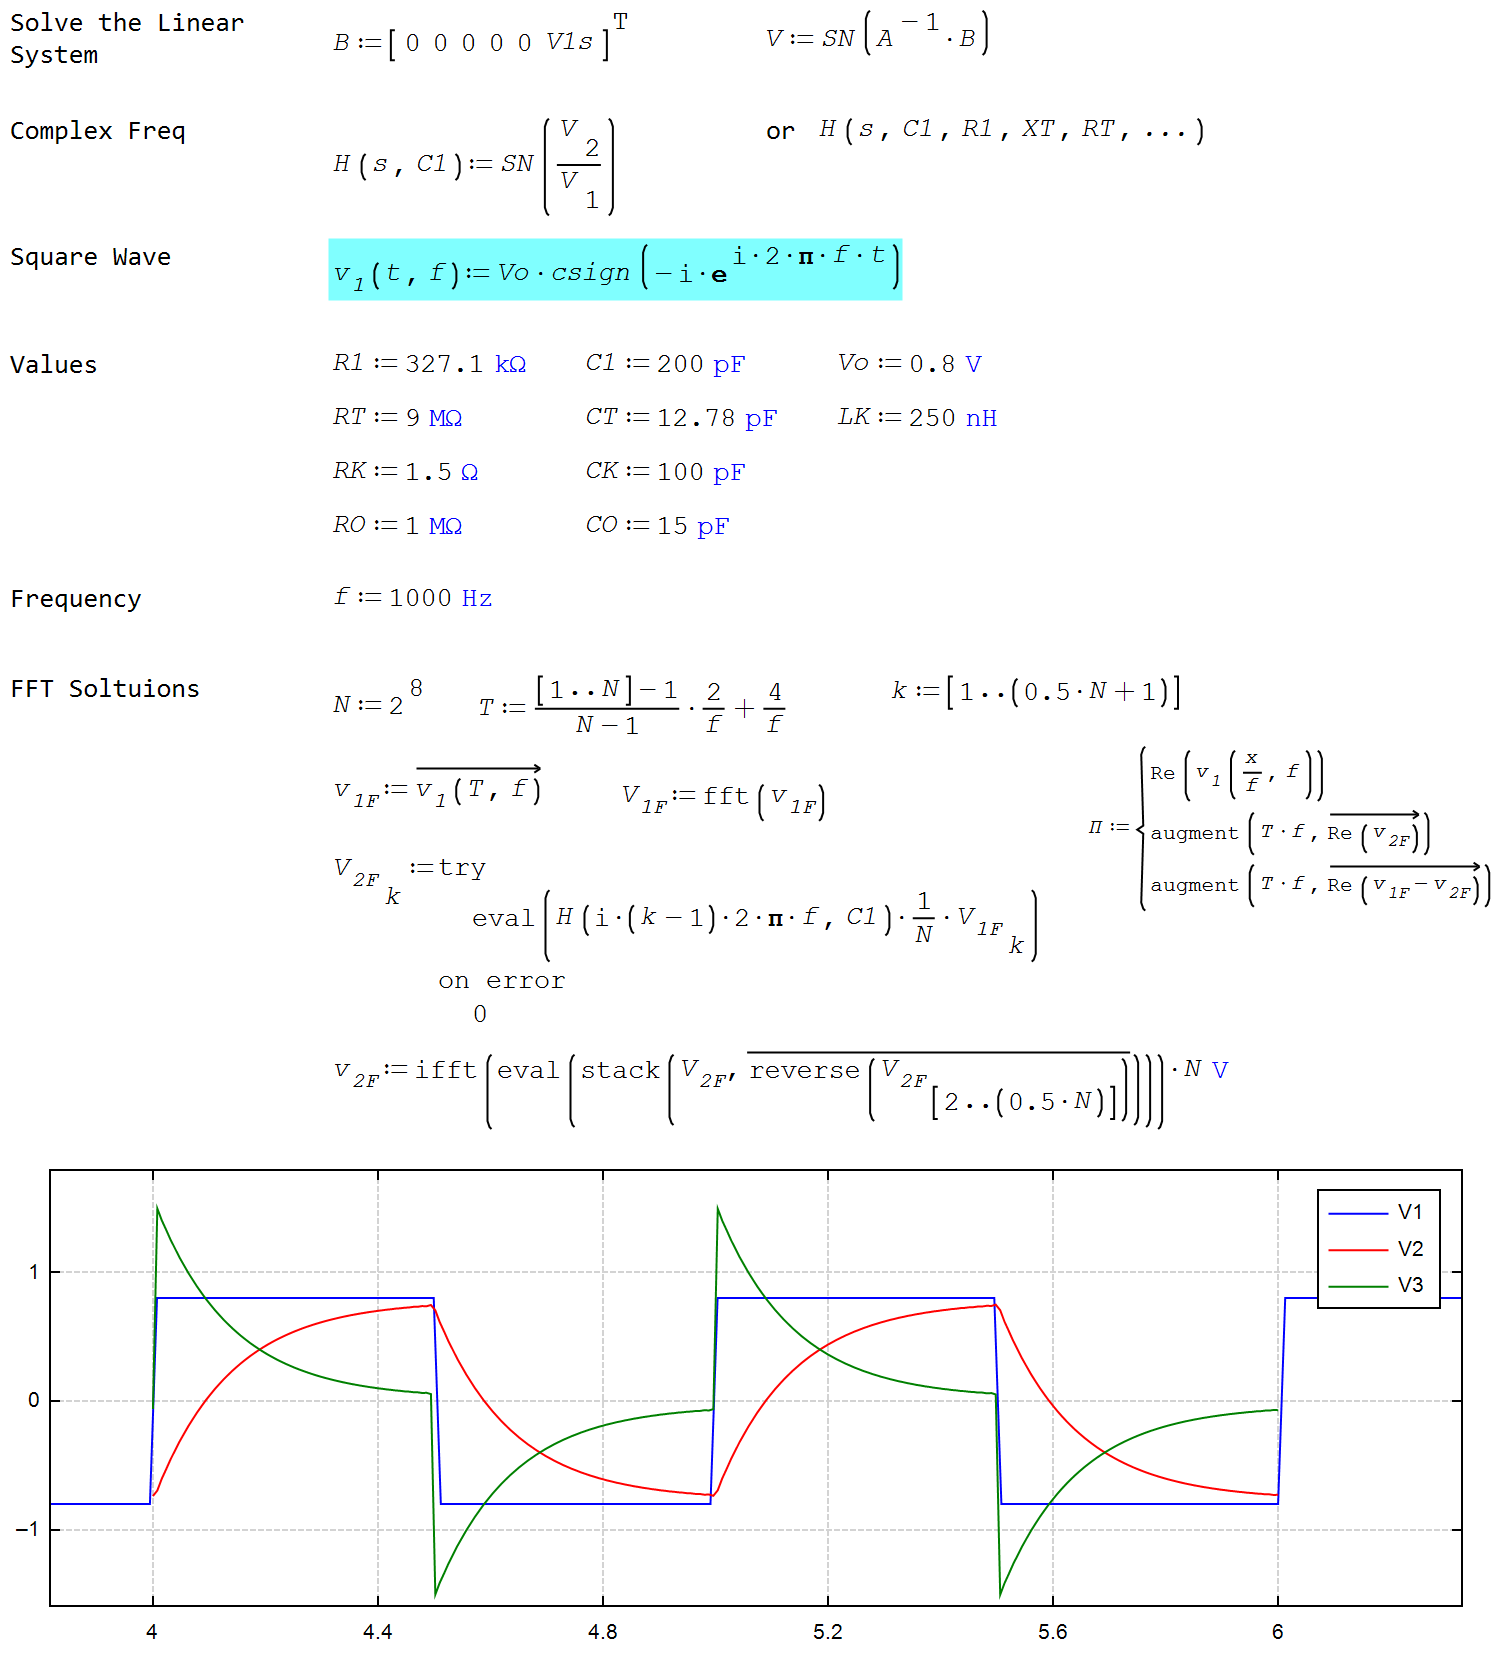
The function H is indeed the transfer function, and it depends only on the complex frequency, and possibly on some circuit variable, such as capacitor C1, but never on time, as you can see in the following image. The SN function is used to simplify its symbolic expression, which is quite long, and is used in the absence of a simplify function in SMath.
The red curve of V2 is calculated using the Fourier transform of V1, because that is the procedure. It doesn't have any smoothing algorithm, such as a Lanczos factor using the sinc function, or anything like that. The procedure applied is quite general and provides the "exact" solution, if we consider "exact" to be something involving infinite series. That is, it doesn't "use" v1(t), but all the information necessary to solve the circuit is in the Fourier transform function V1(s).
If you want the solution without using the symbolic Fourier transform, and you want a fast and reliable numerical solution, you can use the FFT of the input to solve the circuit.
Versuch mit R und C sqare FFT.sm (30.17 KiB) downloaded 384 time(s).
Versuch mit R und C sqare FFT.pdf (580.05 KiB) downloaded 286 time(s).
Best regards.
Alvaro.
The function H is indeed the transfer function, and it depends only on the complex frequency, and possibly on some circuit variable, such as capacitor C1, but never on time, as you can see in the following image. The SN function is used to simplify its symbolic expression, which is quite long, and is used in the absence of a simplify function in SMath.
The red curve of V2 is calculated using the Fourier transform of V1, because that is the procedure. It doesn't have any smoothing algorithm, such as a Lanczos factor using the sinc function, or anything like that. The procedure applied is quite general and provides the "exact" solution, if we consider "exact" to be something involving infinite series. That is, it doesn't "use" v1(t), but all the information necessary to solve the circuit is in the Fourier transform function V1(s).
If you want the solution without using the symbolic Fourier transform, and you want a fast and reliable numerical solution, you can use the FFT of the input to solve the circuit.
Versuch mit R und C sqare FFT.sm (30.17 KiB) downloaded 384 time(s).
Versuch mit R und C sqare FFT.pdf (580.05 KiB) downloaded 286 time(s).
Best regards.
Alvaro.
#19 Posted: 6/25/2026 3:17:06 PM
Hi Alvaro,
a few more insights.
SMath does not recognize that the last two formulas are identical. Not even with the help of the SN function.
Regards Andreas
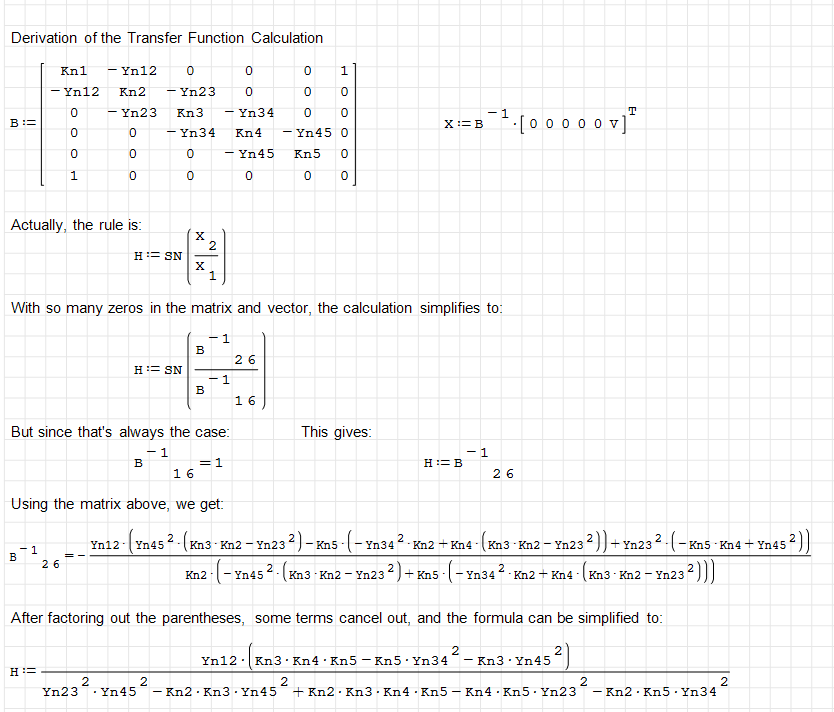
a few more insights.
SMath does not recognize that the last two formulas are identical. Not even with the help of the SN function.
Regards Andreas
1 Pages (19 items)
- New Posts
- No New Posts