1 страниц (4 вхождений)
Simple beam analysis, graph - Simple beam analysis, graph - Сообщения
Hi every one. I have some questions.
Q1) When performing symbolic calculations, I currently have to manually set the optimization to 'numeric' (or 'symbolic'/'none') for each region individually. Is there a way to change the default optimization setting to 'symbolic' or 'none' globally?
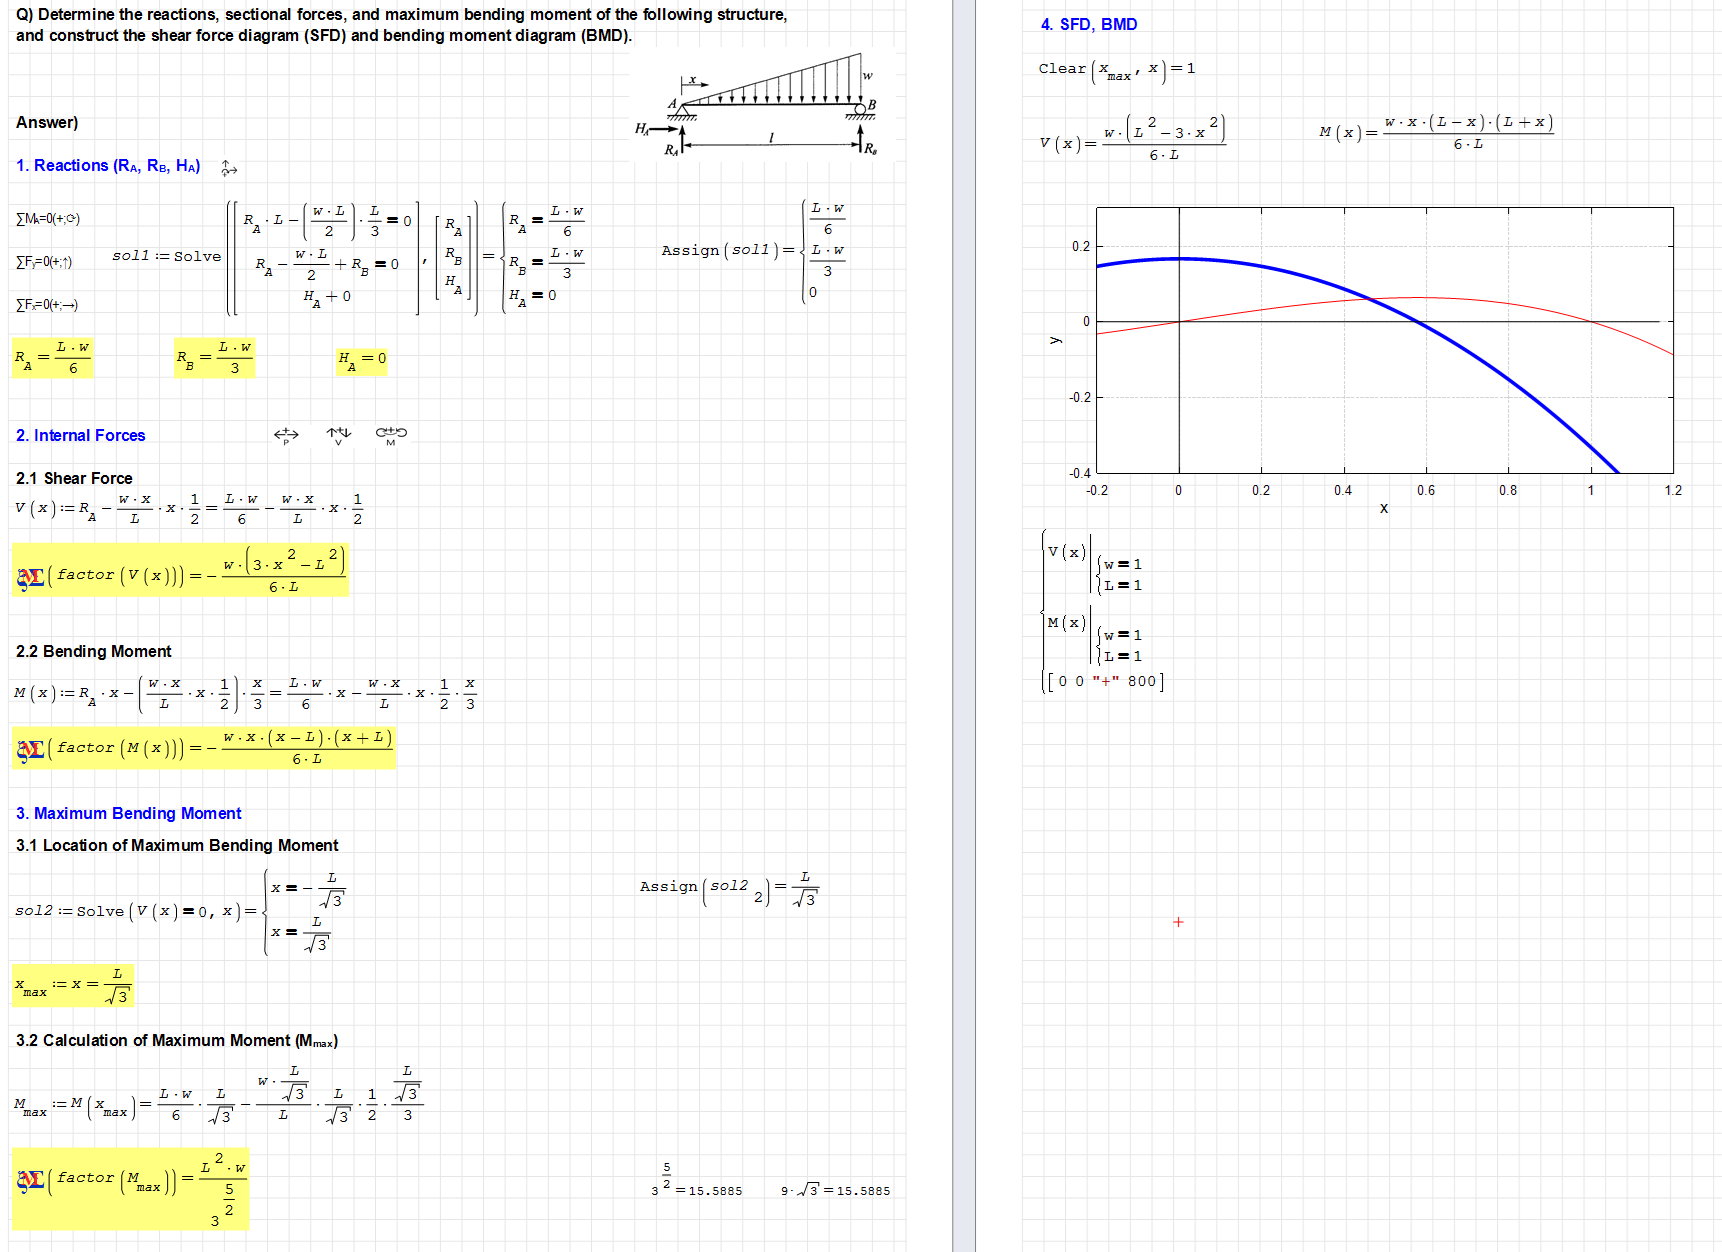
Q2) I have created a worksheet for the SFD and BMD of a simple beam, as shown in the image. I am trying to plot these diagrams using the XY Plot component.How can I restrict the x-axis range to display only the interval from 0 to 1?How can I mark the specific point of M_max on the graph?
Thank you for all.
12.SimpleBeam_01.sm (63,68 КиБ) скачан 629 раз(а).
Q1) When performing symbolic calculations, I currently have to manually set the optimization to 'numeric' (or 'symbolic'/'none') for each region individually. Is there a way to change the default optimization setting to 'symbolic' or 'none' globally?
Q2) I have created a worksheet for the SFD and BMD of a simple beam, as shown in the image. I am trying to plot these diagrams using the XY Plot component.How can I restrict the x-axis range to display only the interval from 0 to 1?How can I mark the specific point of M_max on the graph?
Thank you for all.
12.SimpleBeam_01.sm (63,68 КиБ) скачан 629 раз(а).
a. From Edit menu select All, then right-click on any blue region and select None from the optimisation section.
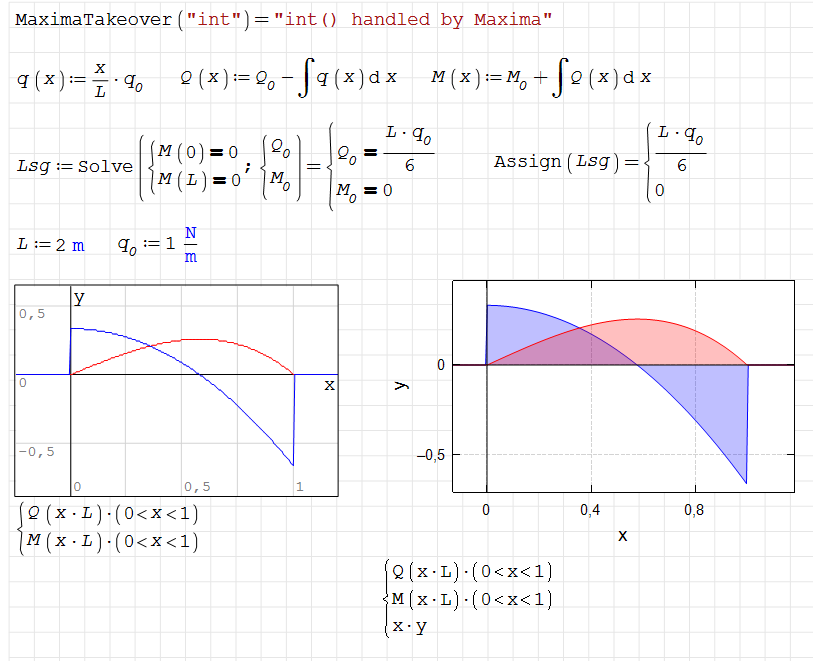
b. Double click on the graph and select the various options on the resulting menu - see attached.
12.SimpleBeam_01b.sm (86,53 КиБ) скачан 677 раз(а).
b. Double click on the graph and select the various options on the resulting menu - see attached.
12.SimpleBeam_01b.sm (86,53 КиБ) скачан 677 раз(а).
1 пользователям понравился этот пост
kimkim 14.12.2025 10:31:17
Wrotea. From Edit menu select All, then right-click on any blue region and select None from the optimisation section.
b. Double click on the graph and select the various options on the resulting menu - see attached.
12.SimpleBeam_01b.sm (86,53 КиБ) скачан 677 раз(а).
I'm so appreciative of you.
When I draw SDF, BMD,' roots' function is more efficient than 'Solve' function as you wrote!!
Thank you.
Technische Mechanik mit SMath Studio: https://link.springer.com/book/10.1007/978-3-658-50592-9
1 страниц (4 вхождений)
- Новые сообщения
- Нет новых сообщений