XY Plot -X and Y axis with variables

XY Plot -X and Y axis with variables - Control the plot axis with calculated values - Mensajes

#1 Publicado: 25/10/2021 19:06:06
Lloyd Snell

Lloyd Snell

0 me gusta en 8 mensajes.

Grupo: User

This is a continuation of learning to plot in Smath, heck learning Smath.
I have been able to get the XYplots correctly done.
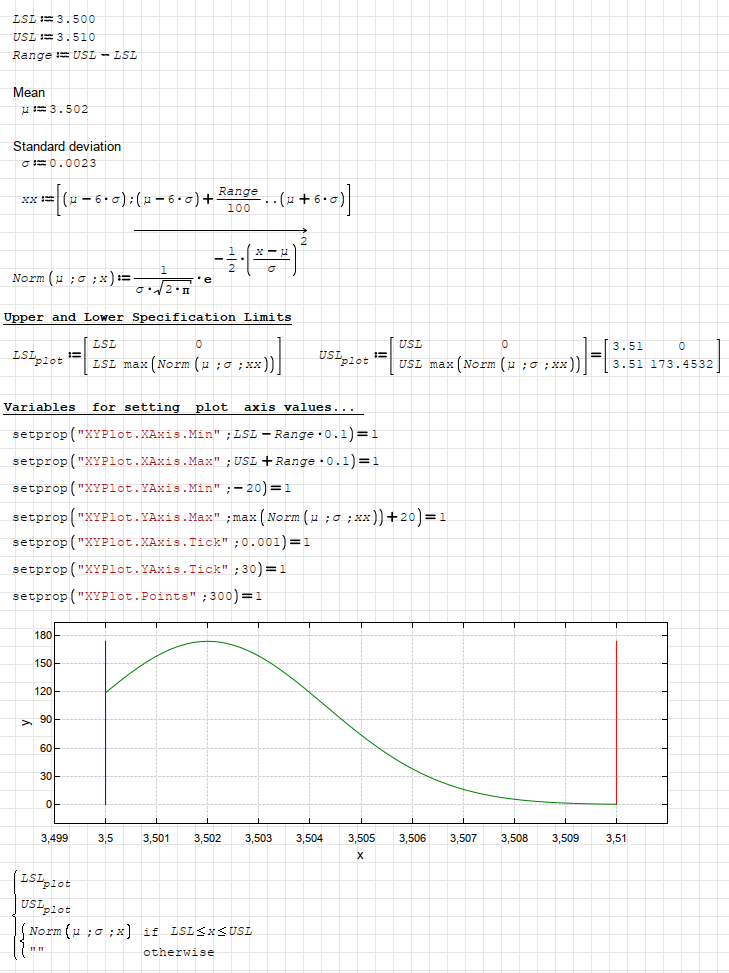
But now I am searching for a solution to define the x- and y-axis min maximum values using calculated values (See the Variables for setting plot axis values ... section).
I am aware formatting X-Y Table, but have not been successful in using it as a place holder for the calculated values, all seems to be static.

Looking forward to your responses.

Lloyd

2D Plot - Axis Control.sm (13,1 KiB) descargado 1232 vez(es).

#2 Publicado: 25/10/2021 21:13:15
overlord

overlord

600 me gusta en 1.381 mensajes.

Grupo: Moderator

There is a function to change the XYPlot settings, setprop().
Here is a demonstration for your file.
And below you can find examples for setprop() settings.

Regards

2D Plot - Axis Control_r1.sm (14,61 KiB) descargado 1298 vez(es).

XYPlotTools.sm (48,94 KiB) descargado 1321 vez(es).

2021-10-26_03-26.png
A 1 usuarios les gustó este mensaje
Oscar Campo 4/11/2022 18:46:00
  • Nuevos mensajes
  • Sin mensajes nuevos