1 Pages (19 items)
Maxima plot - How to add point in maxima plot - Messages
#1 Posted: 1/22/2026 10:52:55 AM

Hi, i would like to add some points to 3D plot. How can I do that?
And can i somehow make the plot smooth without using smaller steps in vectors?
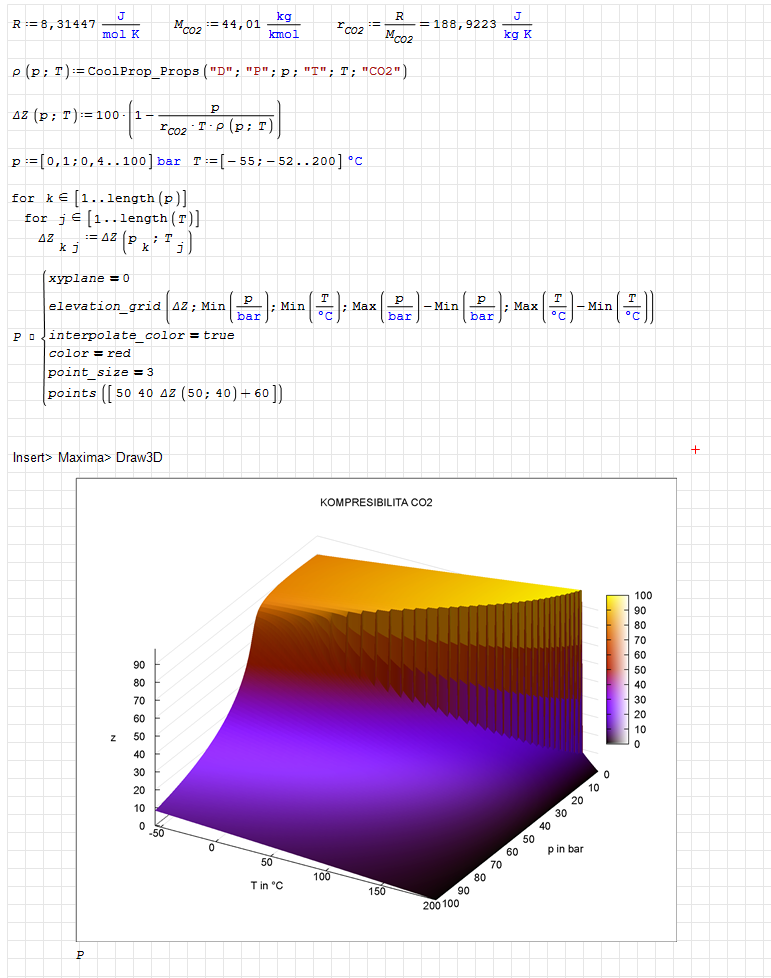
Kompresibilita_3D.sm (56.04 KiB) downloaded 543 time(s).
Thanks for answers,
Tomas
And can i somehow make the plot smooth without using smaller steps in vectors?
Kompresibilita_3D.sm (56.04 KiB) downloaded 543 time(s).
Thanks for answers,
Tomas
Edited 1/22/2026 10:54:05 AM
#2 Posted: 1/22/2026 2:08:14 PM
You could try to create a mesh of triangles or quadrilateral objects. Then you are free to use a problem-adjusted surface parametrization.
Technische Mechanik mit SMath Studio: https://link.springer.com/book/10.1007/978-3-658-50592-9
#3 Posted: 1/27/2026 9:55:32 PM
Hi,
thanks for your answer. I have another question. I´m trying to make graph of water density, but the axes are not right, what is wrong?
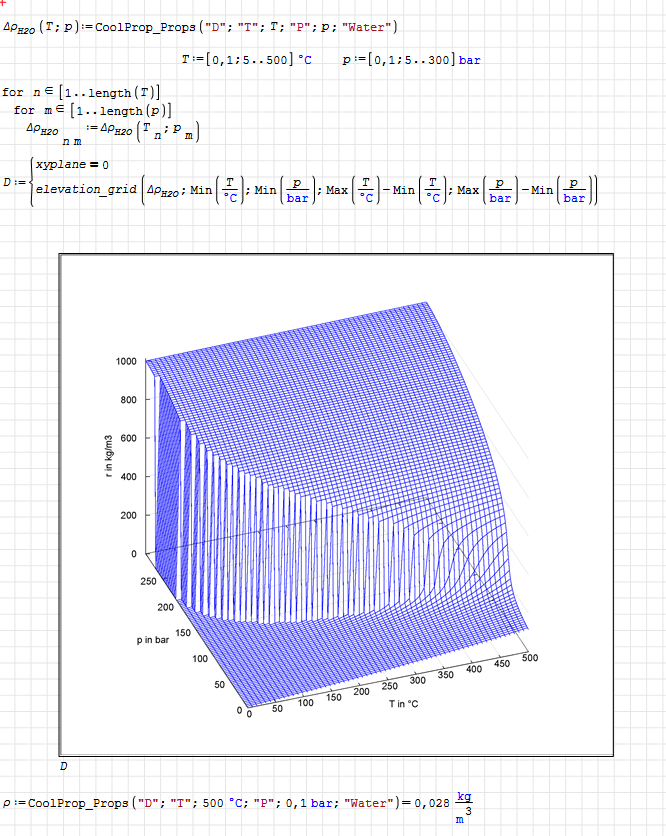
hustota vody.sm (69 KiB) downloaded 436 time(s).
Thanks,
Tomáš
thanks for your answer. I have another question. I´m trying to make graph of water density, but the axes are not right, what is wrong?
hustota vody.sm (69 KiB) downloaded 436 time(s).
Thanks,
Tomáš
#4 Posted: 1/28/2026 12:09:04 AM
This is probably due to the "visual" indexing in the matrix.
Rows in a matrix are increasing top-down, whereas values in y are increasing bottom-up.
Rows in a matrix are increasing top-down, whereas values in y are increasing bottom-up.
Technische Mechanik mit SMath Studio: https://link.springer.com/book/10.1007/978-3-658-50592-9
#5 Posted: 1/28/2026 8:23:58 AM
Thanks you very much! That helped.
But if i want to make axes right i have to switch x and y axes in elevation grid command. I don’t know why.
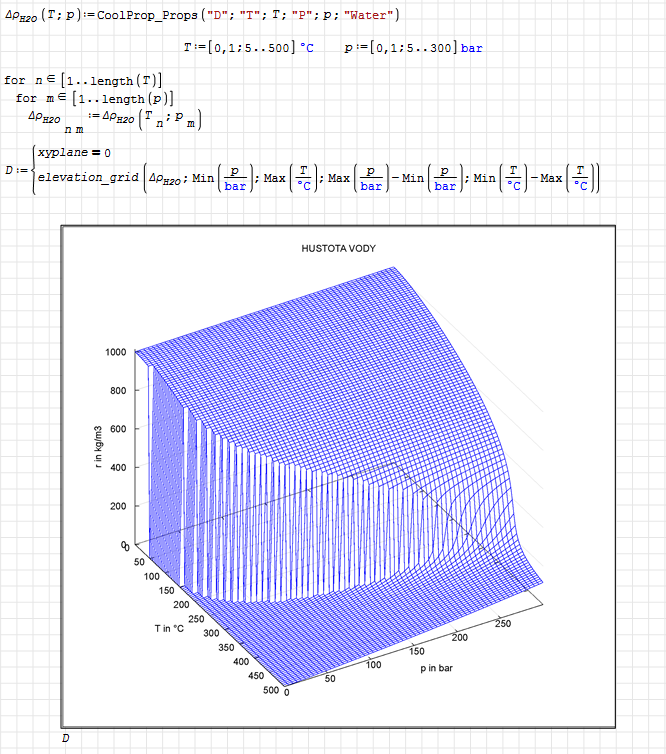
hustota vody.sm (135.01 KiB) downloaded 447 time(s).
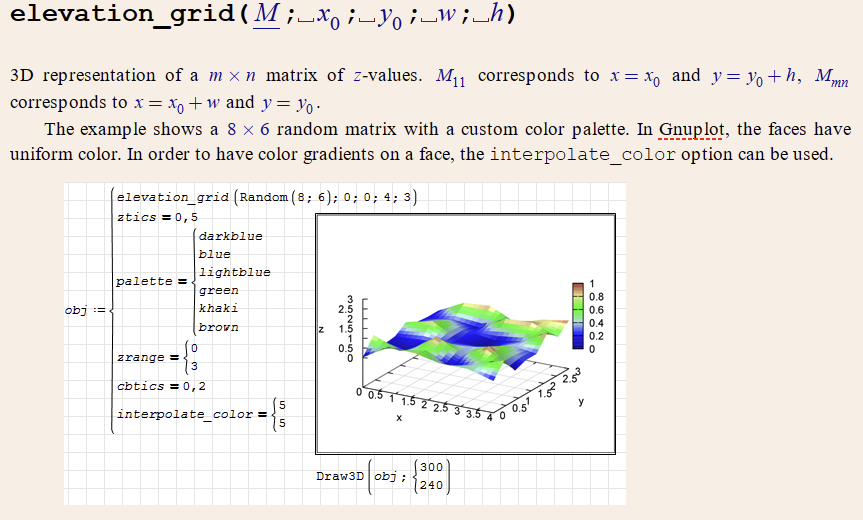
Is there any sheet of something like that, where I can fing all comands for plots? And how can I write them, because commands that I used, I copied from some file I found.
Thanks for answers,
Tomáš
But if i want to make axes right i have to switch x and y axes in elevation grid command. I don’t know why.
hustota vody.sm (135.01 KiB) downloaded 447 time(s).
Is there any sheet of something like that, where I can fing all comands for plots? And how can I write them, because commands that I used, I copied from some file I found.
Thanks for answers,
Tomáš
#6 Posted: 1/28/2026 5:30:00 PM
See topic starter https://smath.com/en-US/forum/topic/cnc5Xp/Maxima-Plugin. I added some references there.
Technische Mechanik mit SMath Studio: https://link.springer.com/book/10.1007/978-3-658-50592-9
#7 Posted: 1/28/2026 7:33:40 PM
That is awesome!
Thanks,
Tomáš
Thanks,
Tomáš
#8 Posted: 2/6/2026 11:03:04 AM
Hi,
how can I add point B to plot? When I tried I make point or plot, but not both of them.
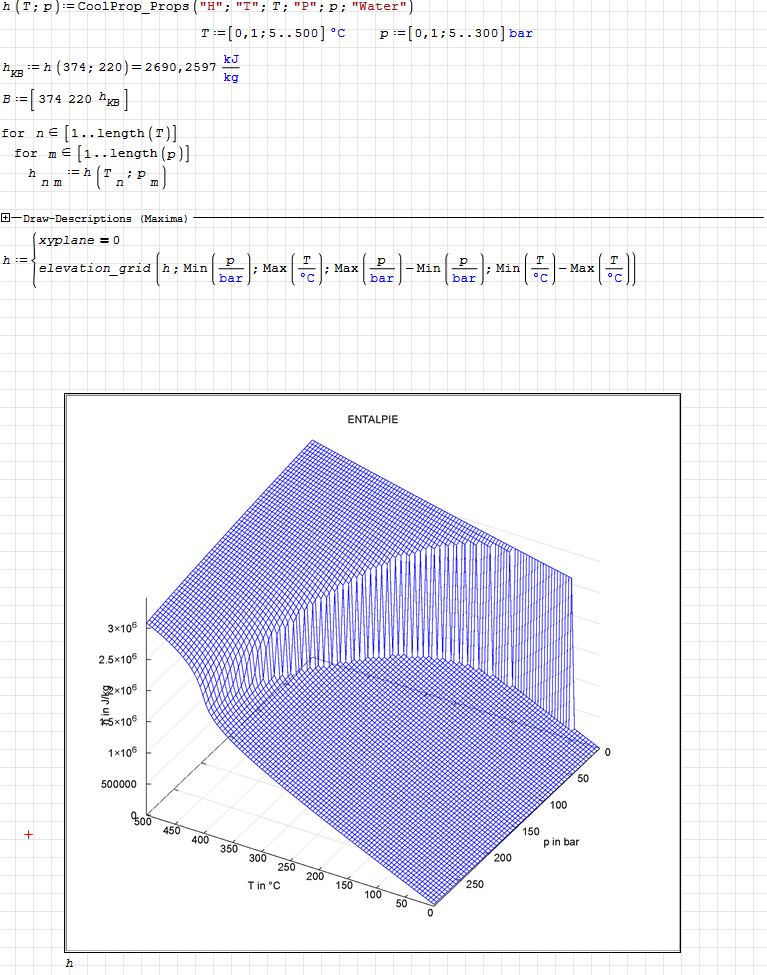
kriticky_bod.sm (202.22 KiB) downloaded 430 time(s).
Thanks for answers,
Tomas
how can I add point B to plot? When I tried I make point or plot, but not both of them.
kriticky_bod.sm (202.22 KiB) downloaded 430 time(s).
Thanks for answers,
Tomas
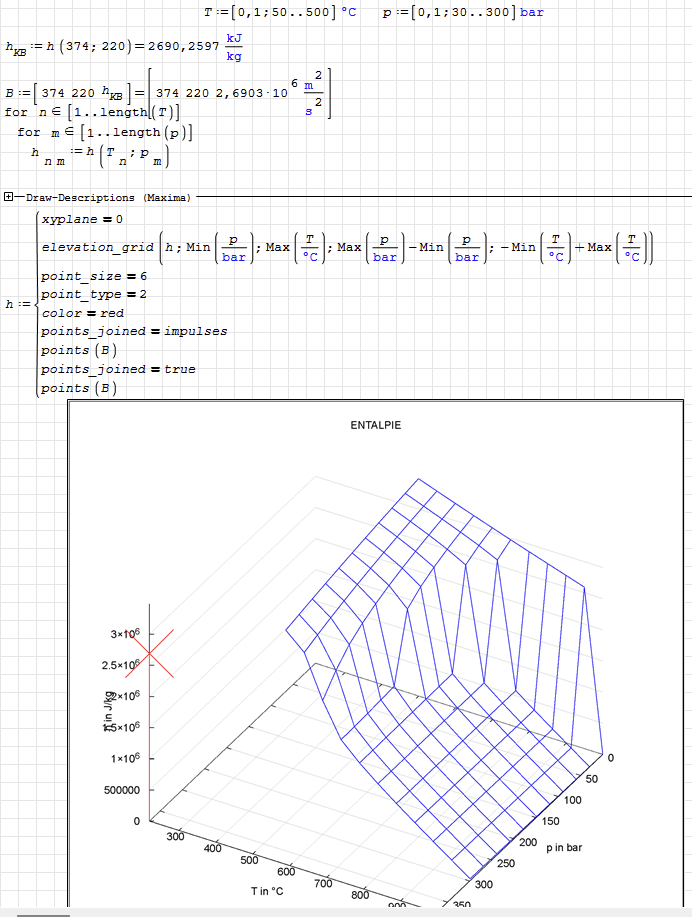
#9 Posted: 2/6/2026 1:25:26 PM
Seems to be related to the negative temperature range in the elevation_grid command.
Technische Mechanik mit SMath Studio: https://link.springer.com/book/10.1007/978-3-658-50592-9
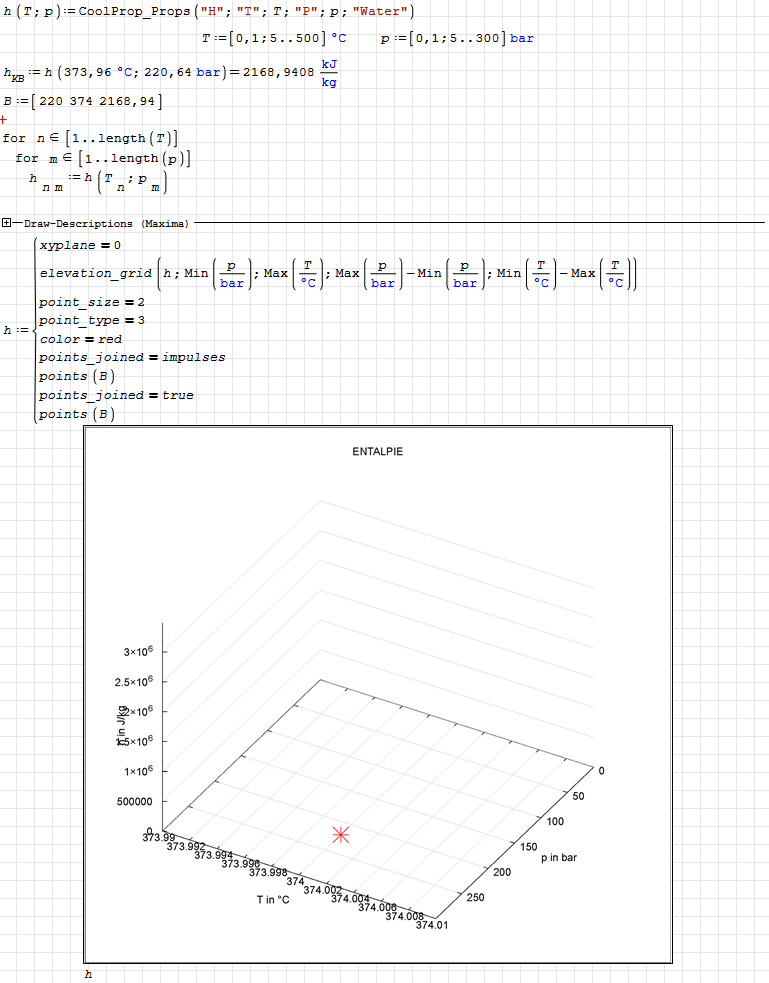
#10 Posted: 2/10/2026 7:29:28 AM
Thanks for answer,
I tried to fix it and I ended with this. Still can t plot graph and point together.
kriticky_bod.sm (201.86 KiB) downloaded 402 time(s).
What should I do now?
Tomáš
I tried to fix it and I ended with this. Still can t plot graph and point together.
kriticky_bod.sm (201.86 KiB) downloaded 402 time(s).
What should I do now?
Tomáš
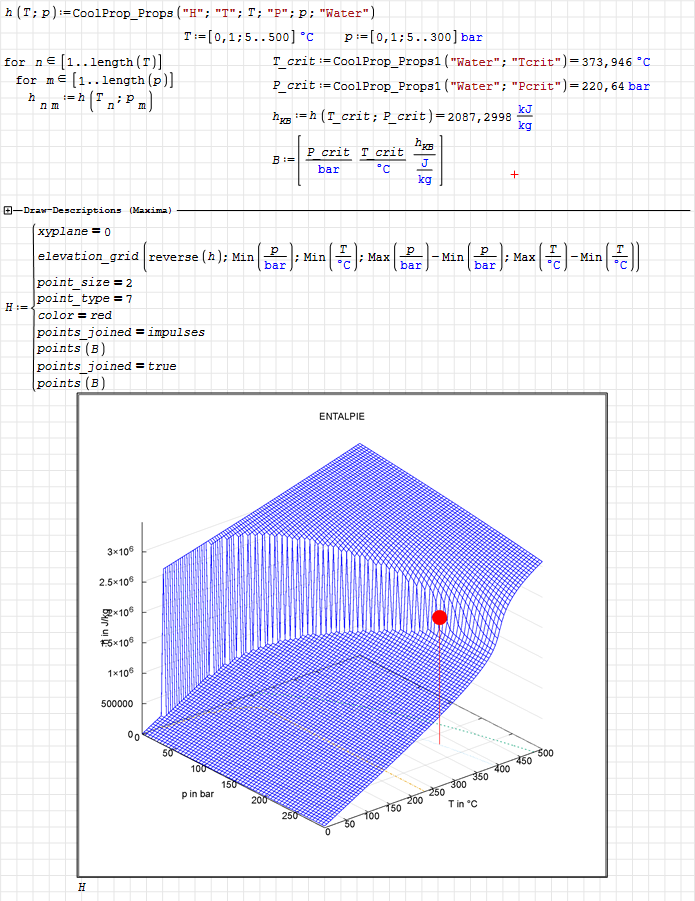
#11 Posted: 2/10/2026 3:54:04 PM
You still have a negative h value (temperature difference). Reverse this (and also reverse the matrix). Then it should work.
Technische Mechanik mit SMath Studio: https://link.springer.com/book/10.1007/978-3-658-50592-9
#12 Posted: 2/19/2026 8:34:45 AM
Thank you very much! It works.
Tomáš
Tomáš
#13 Posted: 2/19/2026 10:12:49 AM
Good to see. You also might display the z values in MJ/kg to get nicer tick labels and play around with the view parameters in the settings menu to avoid interference between axis label and tick labels.
Technische Mechanik mit SMath Studio: https://link.springer.com/book/10.1007/978-3-658-50592-9
#14 Posted: 2/19/2026 11:38:12 AM
Now I would like to add saturation curve. Is it better to go with matrix or function? And how can I do that?
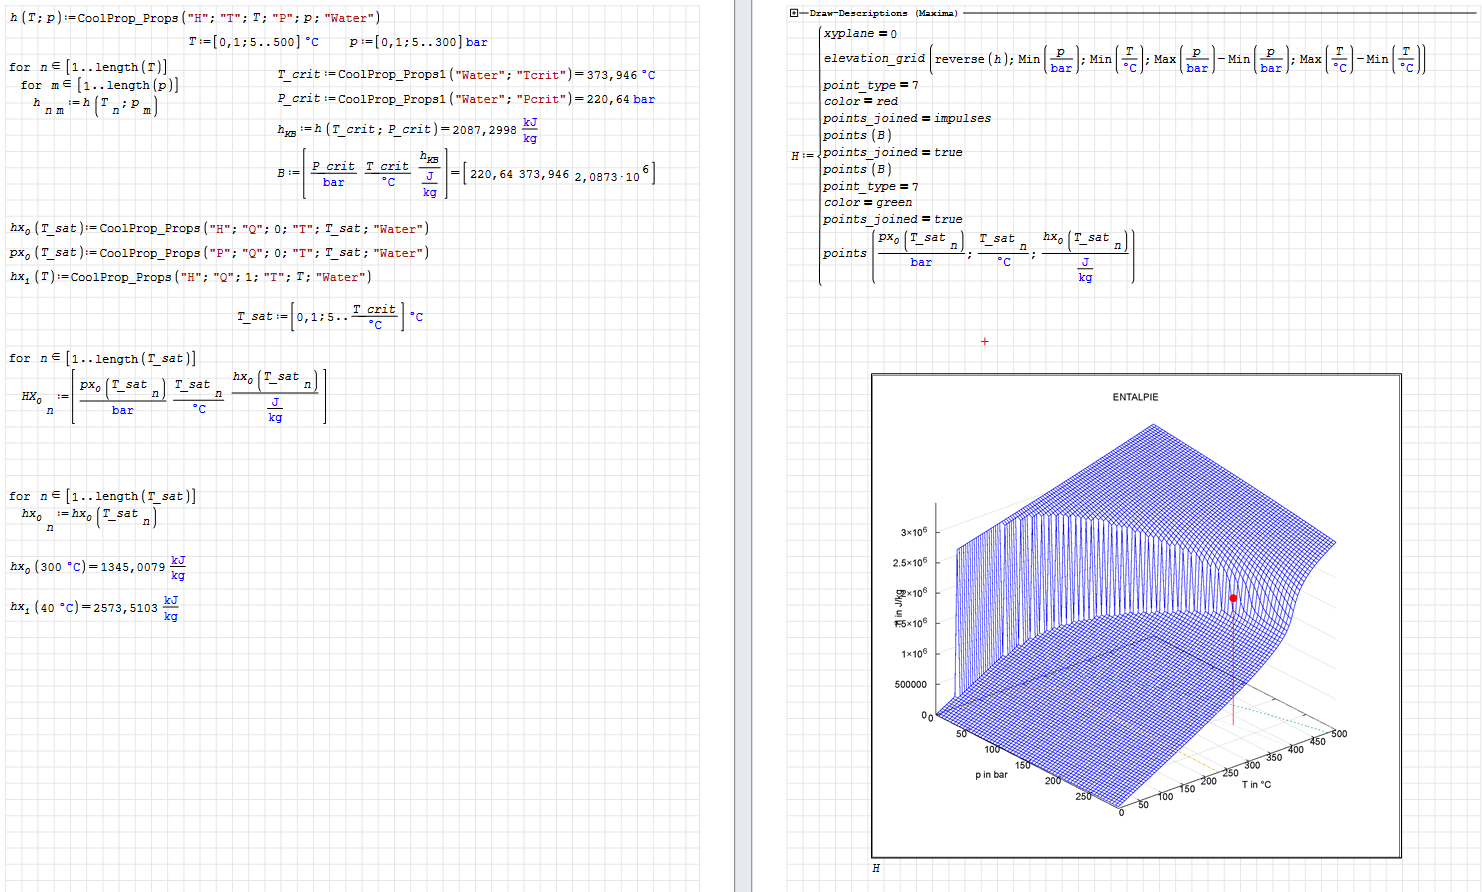
I tried parametric function, but plot did not work.
krit_bod_2.sm (211.84 KiB) downloaded 392 time(s).
Thanks for answers!
Tomáš
I tried parametric function, but plot did not work.
krit_bod_2.sm (211.84 KiB) downloaded 392 time(s).
Thanks for answers!
Tomáš
Edited 2/19/2026 12:05:07 PM
#15 Posted: 2/19/2026 1:01:39 PM
I guess it is best to use the points object just like for the single point. Set points_joined to true, point_type to something convenient. Using a function will work only if that function is supported by the interface to Maxima, which probably doesn't apply to coolprop functions or interpolated functions.
Technische Mechanik mit SMath Studio: https://link.springer.com/book/10.1007/978-3-658-50592-9
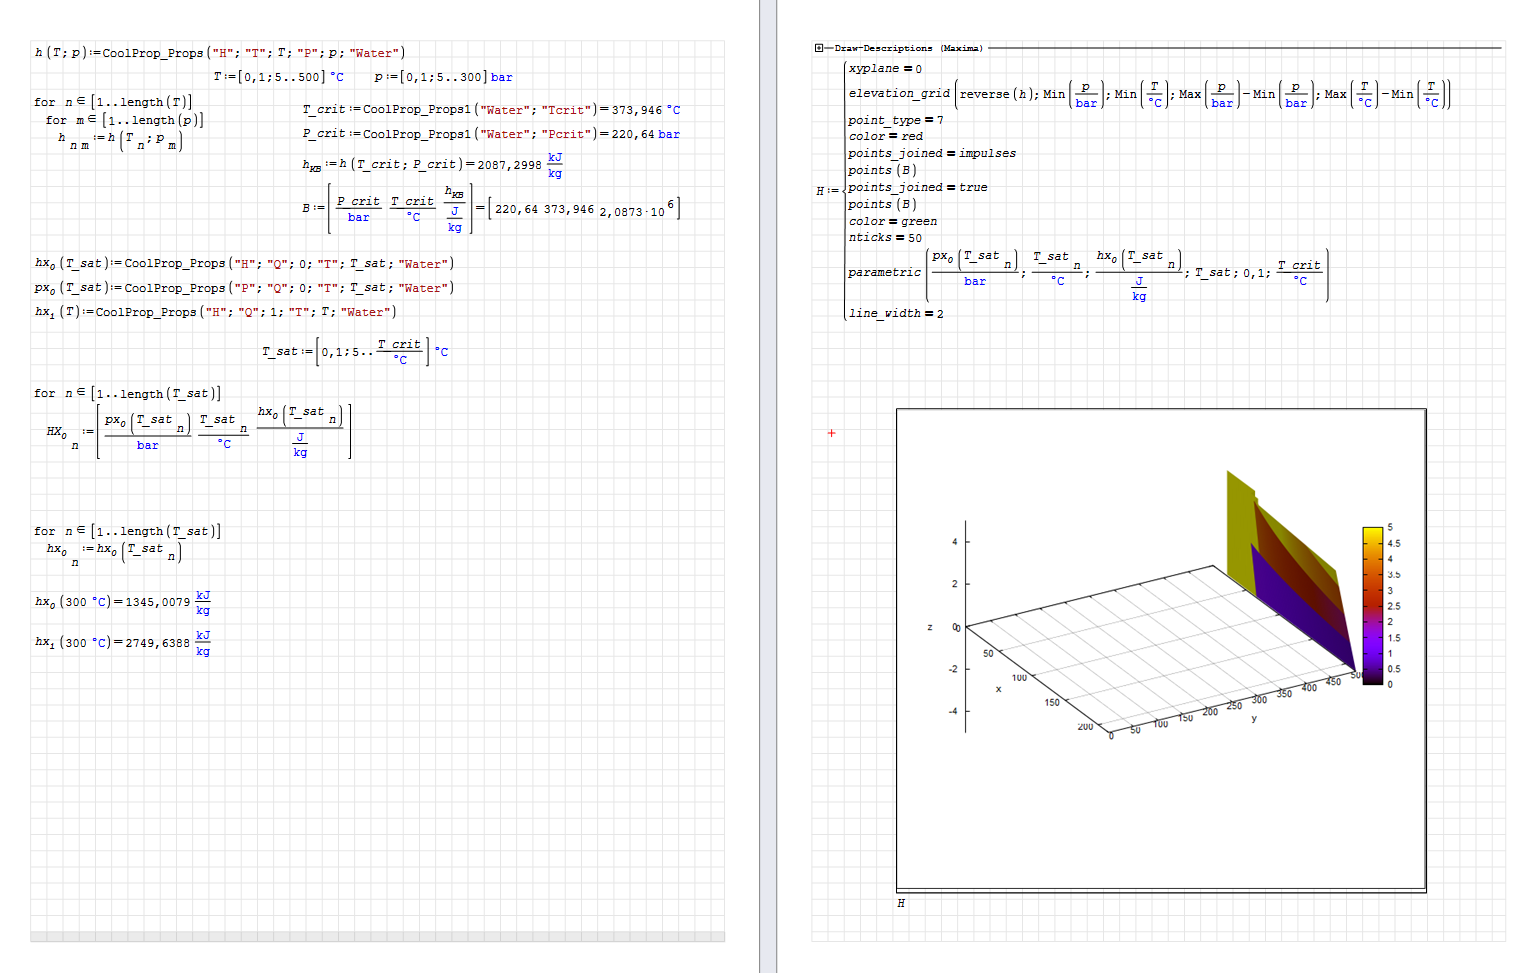
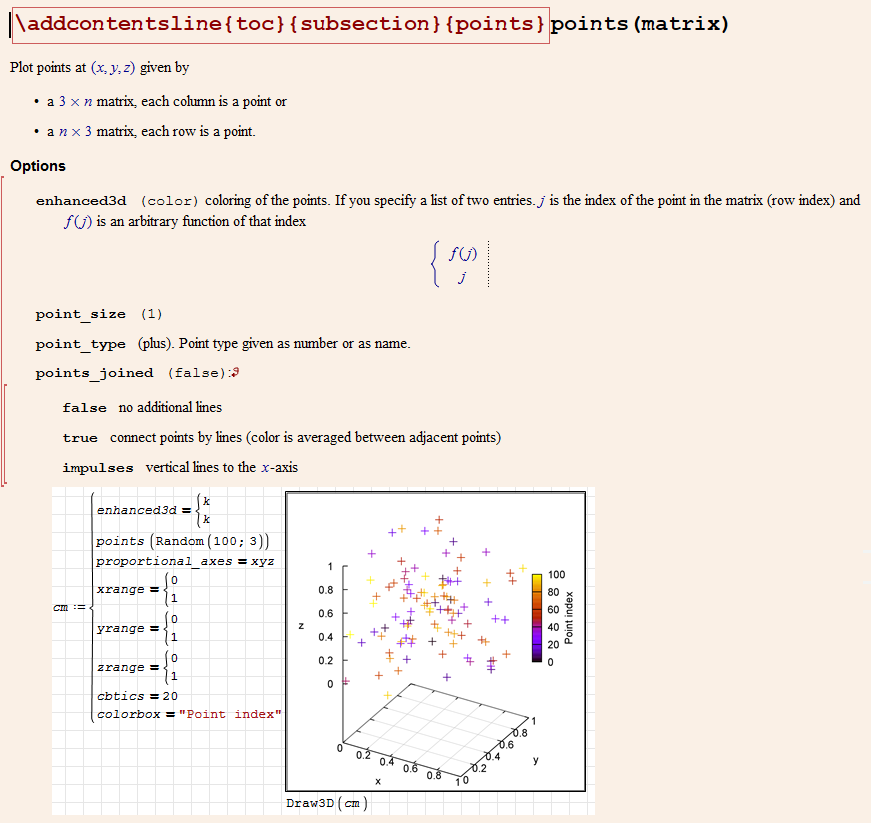
#16 Posted: 2/22/2026 6:05:46 PM
Hi,
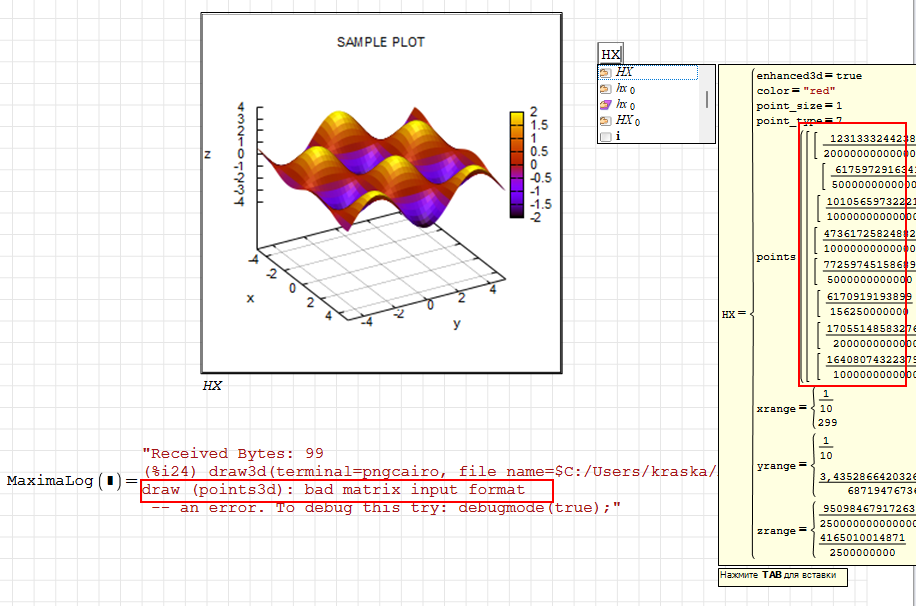
I’m back. I tried to create line of points by maxima handbook. Handbook is really great, but I couldn’t figure it out. What am I doing wrong? Matrix seems right.
And i have another question. When I created plot of enthalpy I just wrote name of the "plot function". But in the manual, there is Draw3D("plot function"). Why is that?
saturation_curve.sm (194.75 KiB) downloaded 351 time(s).
Thanks for your help and patient, I really appriciate it.
Tomáš
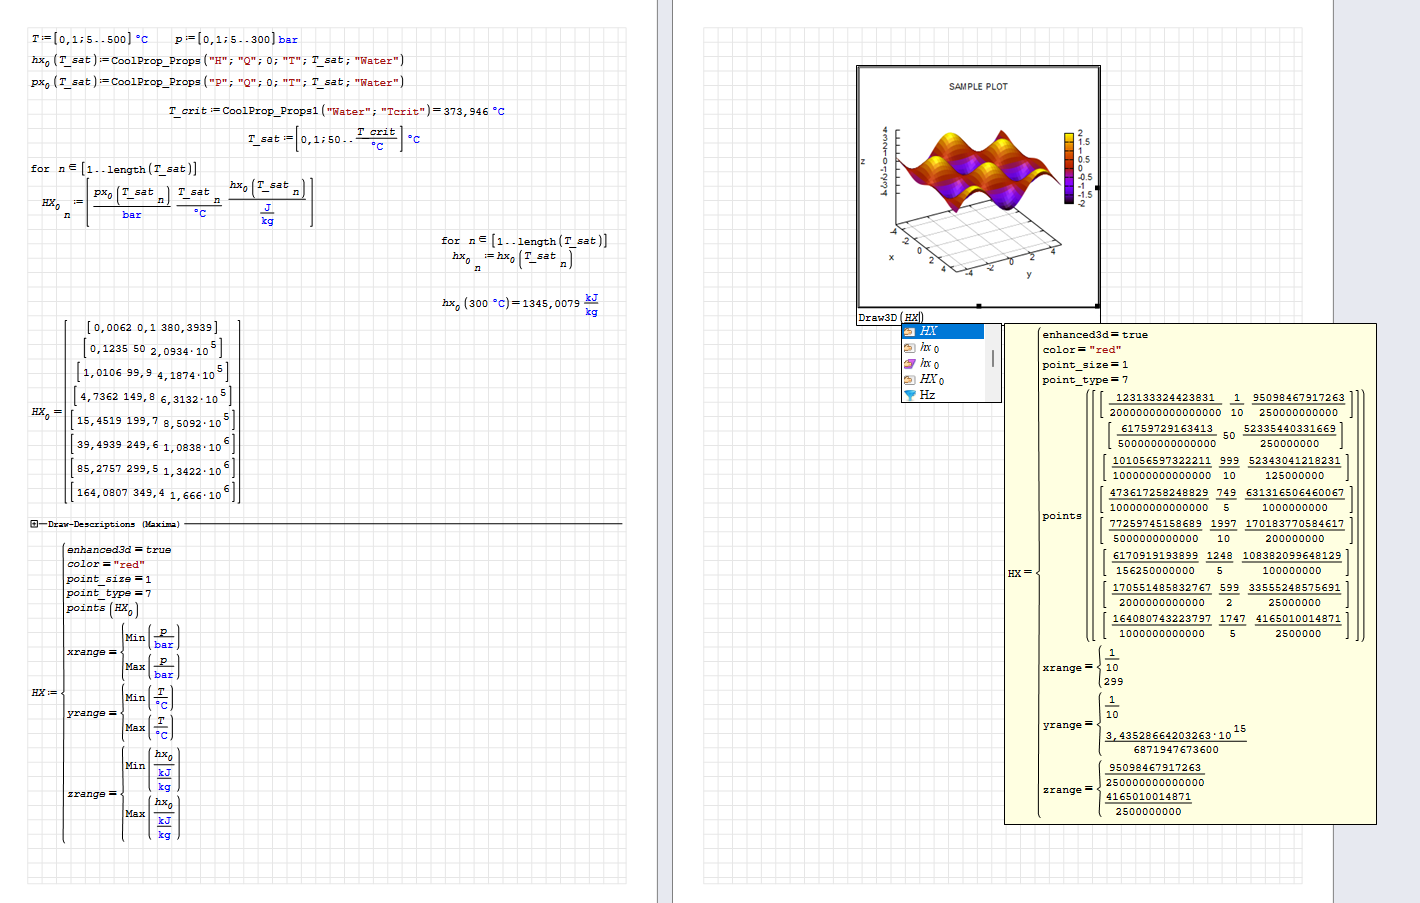
#17 Posted: 2/23/2026 10:20:19 AM
Your data matrix isn't in the correct format. It is a one-column matrix of row vectors. Make it a real n x 3 matrix, then try again.
Also, you use different units when filling the data matrix (J/kg) and for the axis limits (kJ/kg).
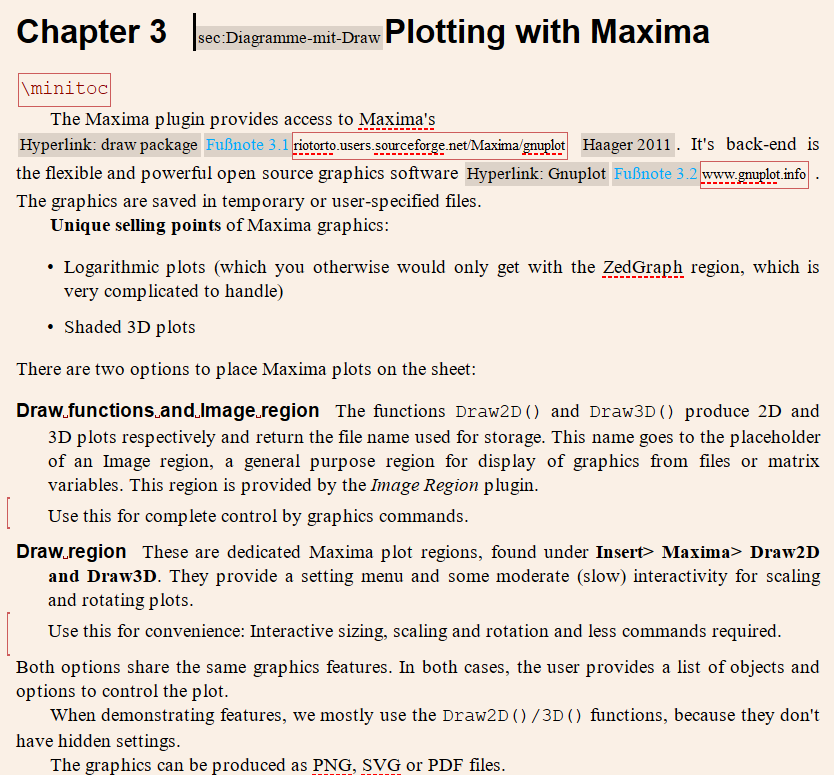
As to the Draw3D command, see intro text to Chapter 3.
Also, you use different units when filling the data matrix (J/kg) and for the axis limits (kJ/kg).
As to the Draw3D command, see intro text to Chapter 3.
Technische Mechanik mit SMath Studio: https://link.springer.com/book/10.1007/978-3-658-50592-9
#18 Posted: 2/26/2026 12:23:13 PM
Hi,
finally I’v done it! Thank you very much Martin! I think it looks great.
Now I would like to continue and mabye try to make something bigger and try to use Smath viewer.
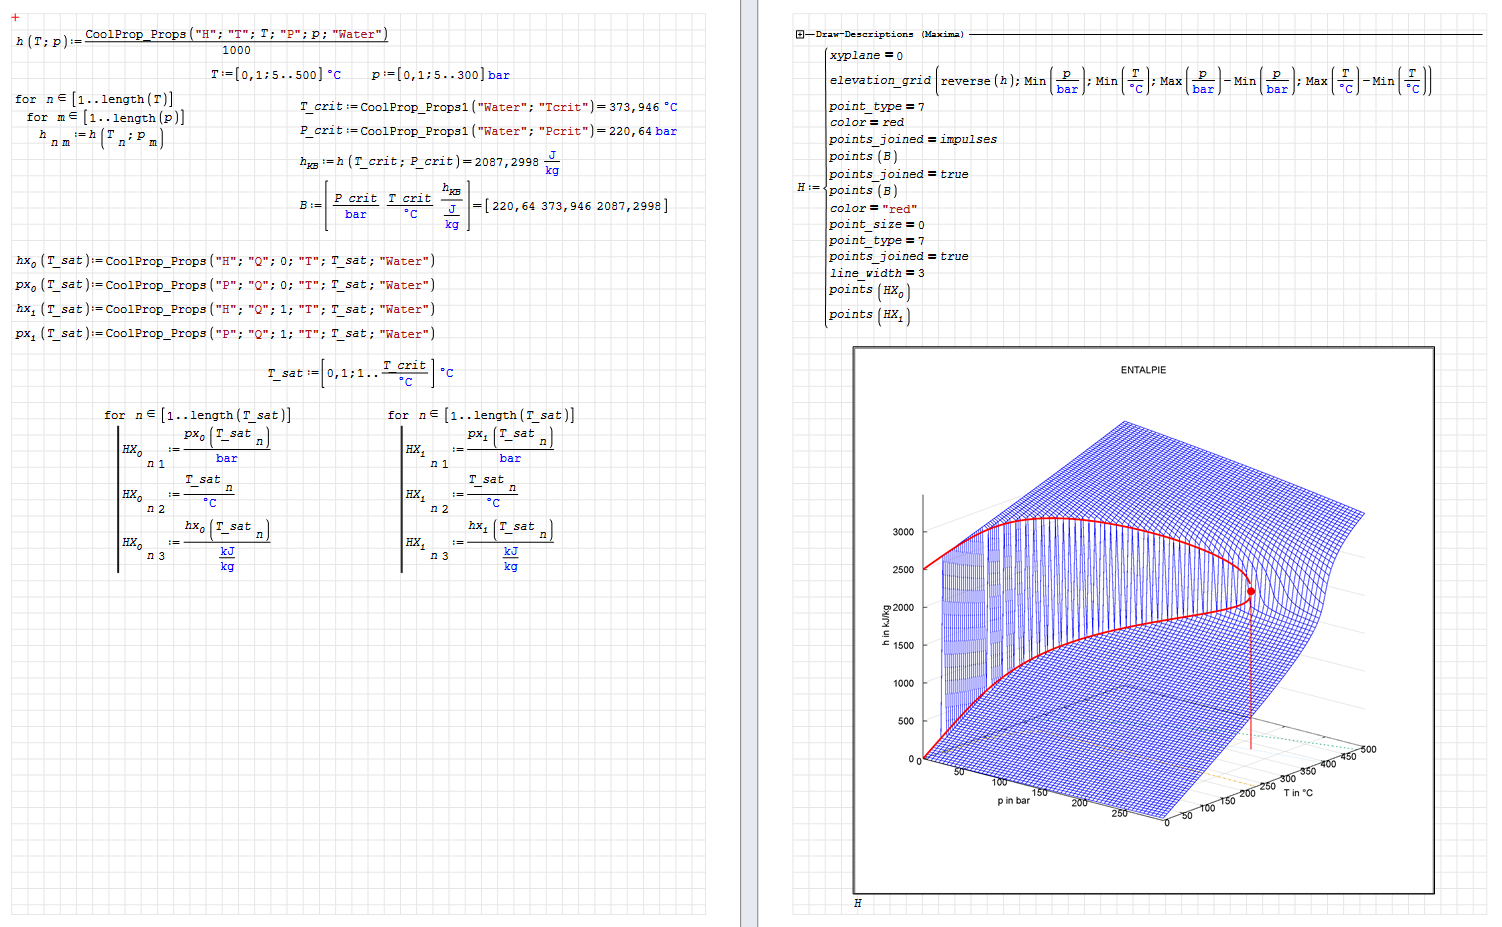
Entalpie_pT.sm (156.56 KiB) downloaded 333 time(s).
Tomáš
finally I’v done it! Thank you very much Martin! I think it looks great.
Now I would like to continue and mabye try to make something bigger and try to use Smath viewer.
Entalpie_pT.sm (156.56 KiB) downloaded 333 time(s).
Tomáš
1 users liked this post
Martin Kraska 2/26/2026 4:32:09 PM
#19 Posted: 2/26/2026 4:31:44 PM
Interesting example. It would also be interesting to set up a chat bot with knowledge of all the SMath handbooks and forum posts.
BTW, I didn't test the viewer with the Maxima plugin, at least no particular provisions have been made to make it work in the viewer. Strictly speaking, such a viewer executable would need to contain a portable Maxima installation. This is not a trivial thing, as a lot of environment variables have to be set, In the begin of the development, we used to modify the Maxima installation (Maxima.bat under Windows), yet that had to be updated for each new version of Maxima, so that we switched using a non-modified entirely generic Maxima installation on the computer. Up to now this approach seems to be robust, yet not portable.
There have been multiple examples of using 2D plots for 3D diagrams by means of coordinate transformations. That might be a Viewer-proof option.
Technische Mechanik mit SMath Studio: https://link.springer.com/book/10.1007/978-3-658-50592-9
1 Pages (19 items)
- New Posts
- No New Posts