X-Y Plot Region - Extends SMath Studio with a X-Y Plot Region. - Messages

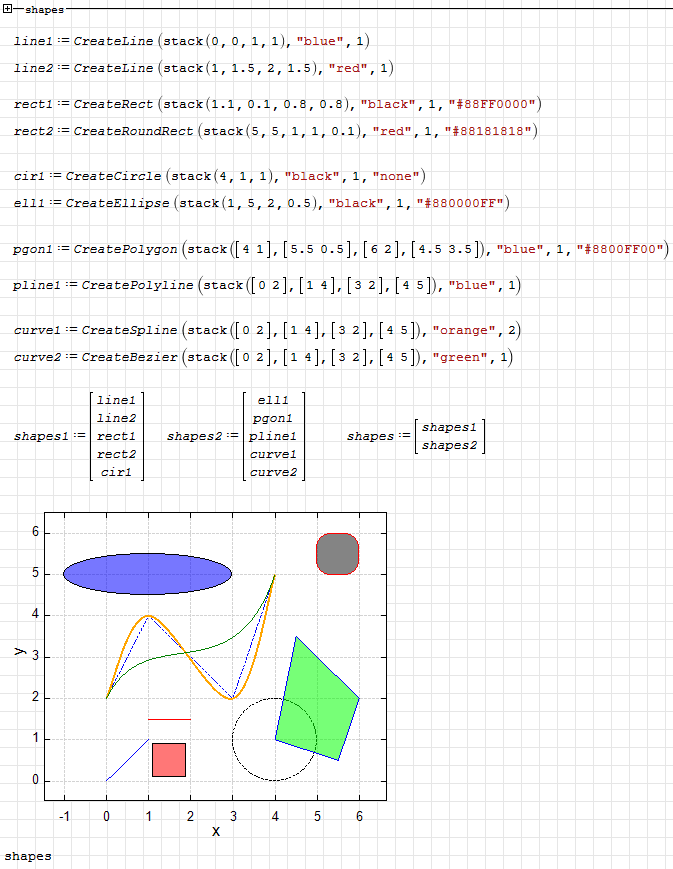
X-Y Plot. Draw shapes.sm (29.3 KiB) downloaded 792 time(s).
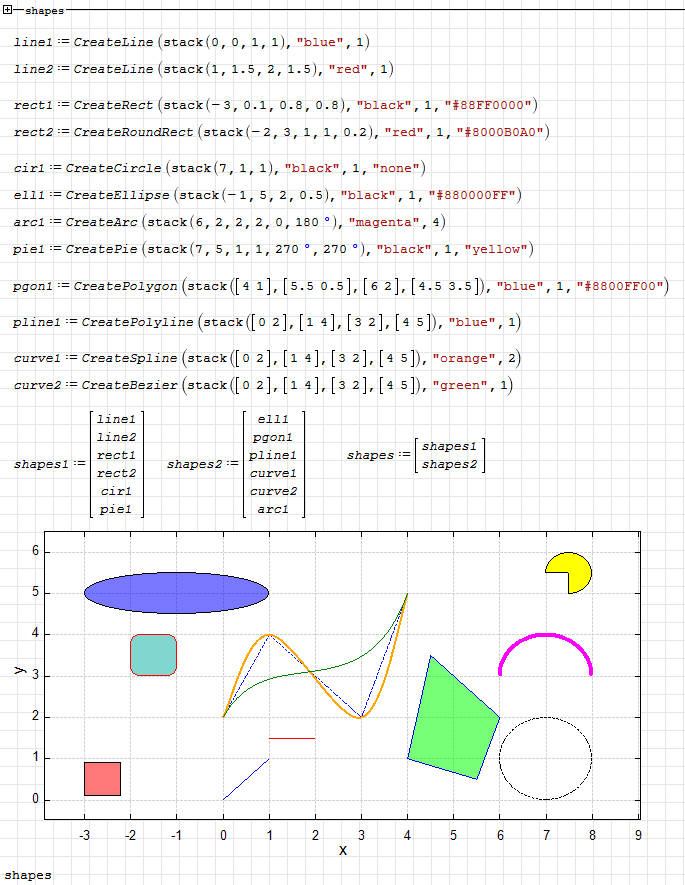
X-Y Plot. Draw shapes.sm (34.81 KiB) downloaded 837 time(s).


WroteHow about a simple arrow?
I do not know how to do it better. The arrow should look good in different scales and in its own size.
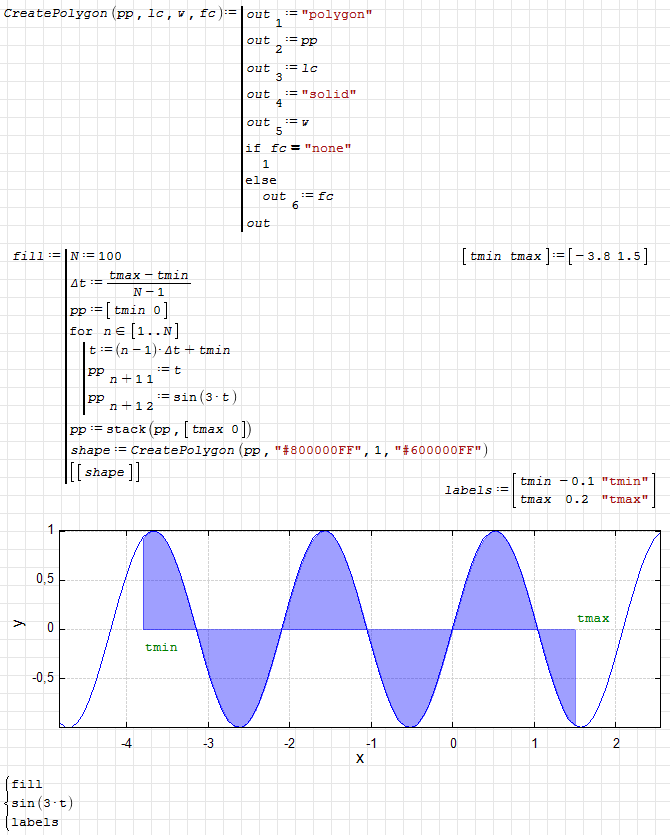
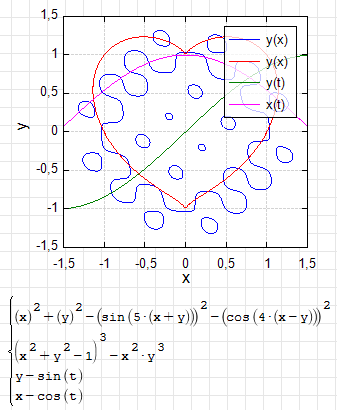
WroteI saw the picture above made by uni and just remembered that many times users mentioned filling option (fill the area below the curve and x-axis) and workarounds in standard SMath plot.
Future plans:
- add a bar plot;
- add a contour plot;
- add a color map plot;
- add a vector field plot.
As for the log scale, for now I don't know how to add it without breaking the old documents.
WroteHow about a simple arrow?
I don't see what I posted few hours ago ?
2D Util Bar Arrow.sm (23.12 KiB) downloaded 811 time(s).
WroteHow about a simple arrow?
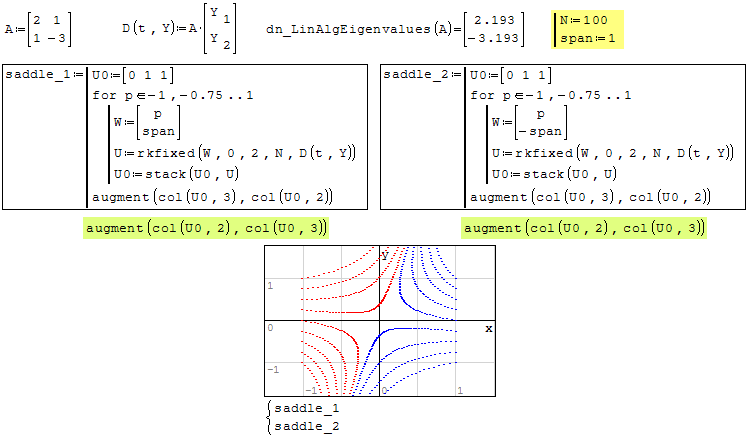
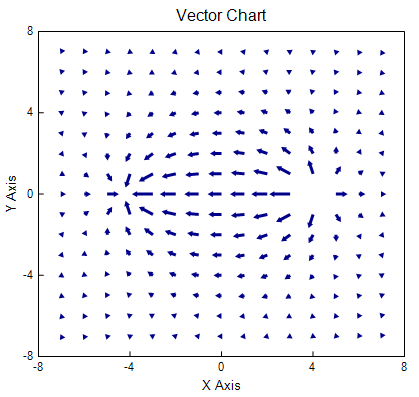
We have the Mathcad code for vector field arrow, pretty involved.
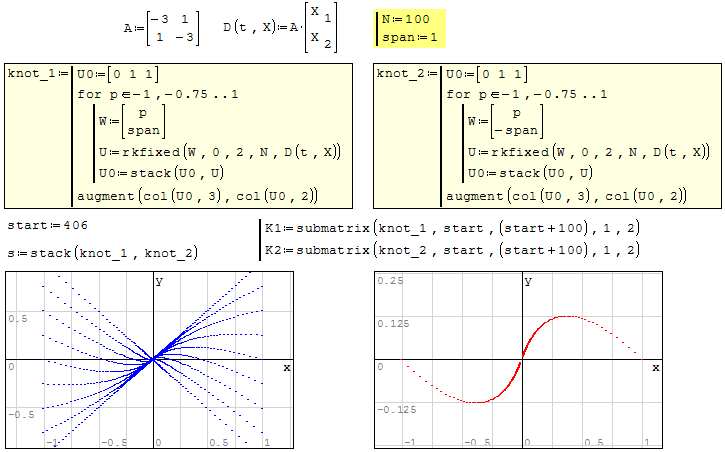
Very superb to appreciate some DE solution as it evolves.
Be careful

WroteThe legend shows line patterns even if line visibility is set to false for the data series.
Workaround: Set the line color to transparent (see left plot).
Updated. Fixed.
Wrote- add a vector field plot.
Wrote- add a vector field plot.
Wrote- add a vector field plot.
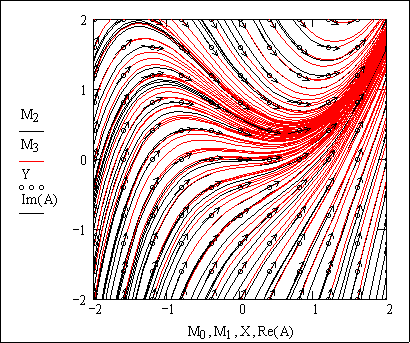
MCD arrow style on low populated field is OK.
MCD arrow style on high populated field ... just horror.
To all.
I can add more plot styles (or regions):
- stem, error, area, stock, stairstep, bar, countur (color mapped), vector field (these styles can be added to xyplot region);
- polar;
- pie.
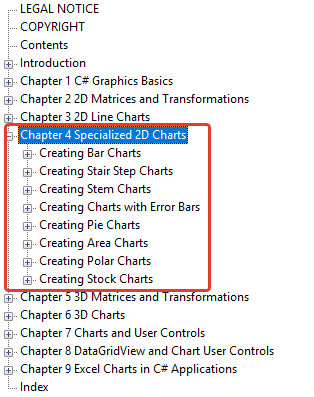
All these graphs are described in the book from Jack Xu: Practical C# Charts and Graphics.
I need more time to port all of them to SMath Studio.
Now I found a way to save region settings automatically (without built in serialization). I hope that I will be able to use it in the general case. I have to change the format of saving the xyplot region settings to extend it.
You can open old versions of documents, but older versions of SMath Studio will not be able to display new documents correctly.
How do you look at such changes or what do you think about it?
WroteJean, I already have code for this:
Thanks Uni for working all those stuff.
We still need a 3D matrix style for different usages
but mostly Catmul-Clark 3D splines and mesh.
Jean
my modest opinion is that I see as really positive the implementation of all these features/changes mentioned in your earlier e-mail ; they are really welcome even if new documents will not be displayed in old Smath version .
Best regards
Franco
thank you very much for your work on X-Y Plot Region.

I'm plotting measured data visible as symbols and regressions as lines like this:
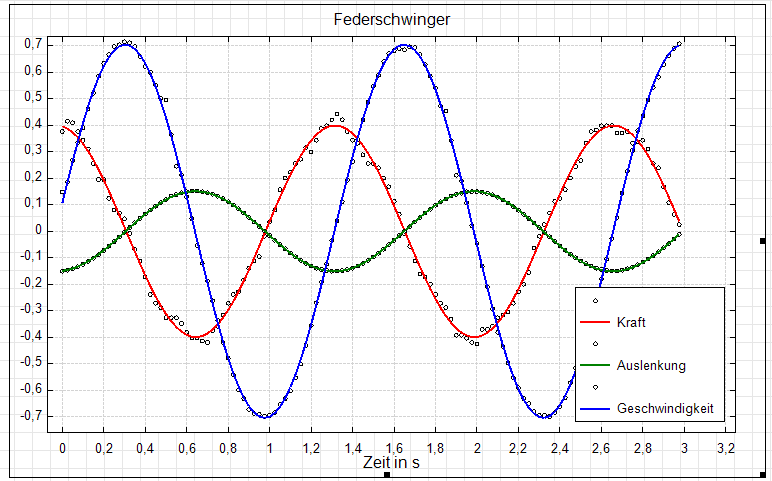
It is possible to change the behavior of the legend? Entries without names should not be displayed in the legend.
Many thanks, Manolo
WroteIt is possible to change the behavior of the legend?
Entries without names should not be displayed in the legend.
If you want too look smart for the reader and hide the source,
just identify "N/A: Confidential".
WroteIt is possible to change the behavior of the legend? Entries without names should not be displayed in the legend.
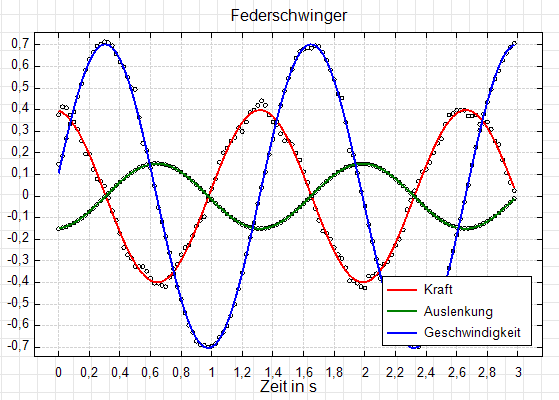
Updated. Try now.
thank you for quick response. Plugin works as desired.
de_Energieumwandlungen_Federschwinger.sm (149.55 KiB) downloaded 805 time(s).
Manolo
- New Posts
- No New Posts