There are three functions in SMath for spline interpolation:
linterp('X-vector','Y-vector','x') - Returns a linearly interpolated value at x for data vectors X-vector and Y-vector of the same size.
cinterp('X-vector','Y-vector','x') - Returns a cubic spline interpolated value at x for data vectors X-vector and Y-vector of the same size.
ainterp('X-vector','Y-vector','x') - Returns Akima-spline interpolated value at x for data vectors X-vector and Y-vector of the same size.
Here is the example of presenting these functions:
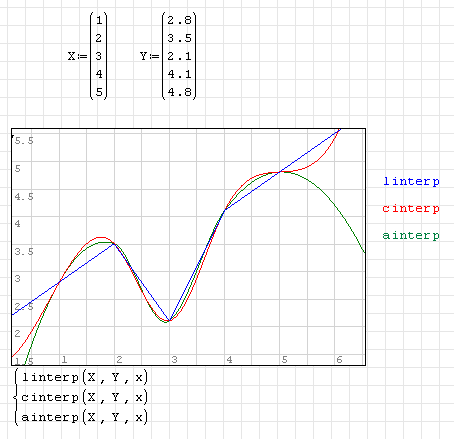
Notice how misleading all of these functions are outside the limits of the original datapoints, ie below x=1 and above x=5. Try and make sure that you only use these for interpolation, not extrapolation.
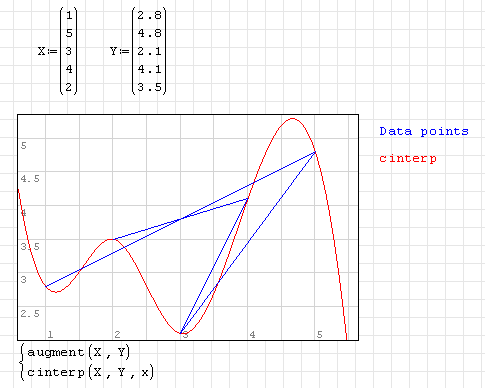
You can have the X-vector sorted in ascending order:
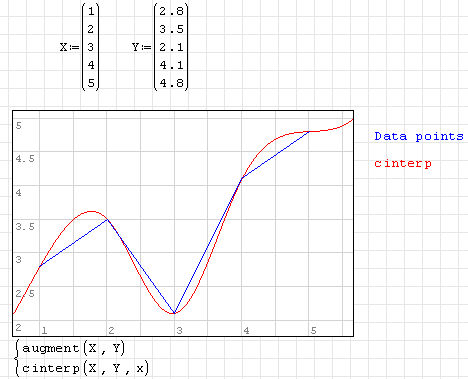
And also
X-vector not sorted . As the main usage of the interpolation is to estimate y-value for the x-value not given in the table, this is
not advisable: