X-Y Plot Region - Extends SMath Studio with a X-Y Plot Region. - Сообщения

Plugin updated.
Changes:
- fixed: when cloning a component and changing its name, the function setprop() doesn't work.
Russia ☭ forever, Viacheslav N. Mezentsev
1 пользователям понравился этот пост
Oscar Campo 28.02.2024 00:14:00
WrotePlugin updated.
Is there a fucntion of autoscale? To find the plot as soon as it's created
There is no automatic detection of curve boundaries.
Russia ☭ forever, Viacheslav N. Mezentsev
WroteThere is no automatic detection of curve boundaries.
Are you planning to add this? Or is it impossible?
It's possible, but I don't know what to do in special cases. For example, if I want to draw a circle in an implicit way, how can I determine its boundaries.
Russia ☭ forever, Viacheslav N. Mezentsev
WroteIt's possible, but I don't know what to do in special cases. For example, if I want to draw a circle in an implicit way, how can I determine its boundaries.
Hi. Although setprop provides the ability to adjust the limits, it disables formatting the graph with the menus. An intermediate and easily accessible solution would perhaps be to be able to define the window where you want to view the functions to be graphed with something like what is shown in the figure.
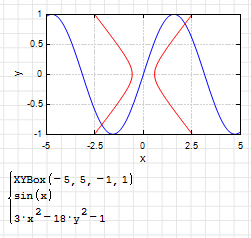
Notice also that there is no automatic selection for the range on the x-axis for functions of a variable, that is, it always has to be selected by the user, and on the y-axis it can become something quite arbitrary, as it can be in graph of y=1/x.
Best regards.
Alvaro.
WroteIt's possible, but I don't know what to do in special cases. For example, if I want to draw a circle in an implicit way, how can I determine its boundaries.
You can do this experimentally and disabled by default. If a graph is being built, its extreme points are determined (top-bottom, right-left), 5-10% of the coordinate values are added (if the left or bottom point is 0, then the axis starts from zero) and the graph is scaled.
You can add horizontal, vertical, or both axis scaling
How to autoscale in these and similar cases? It makes sense to change sources if the architecture of the changes has a general form, and not a lot of particulars. The developer must consider multiple use cases, as users will then ask why it only works in one or a few cases.
Russia ☭ forever, Viacheslav N. Mezentsev
Wrote
How to autoscale in these and similar cases? It makes sense to change sources if the architecture of the changes has a general form, and not a lot of particulars. The developer must consider multiple use cases, as users will then ask why it only works in one or a few cases.
In this case, you can write "the boundaries of the graph could not be determined". That's it!)
Any way to plot a string at a specified angle?
A simplified version of setting properties will be available when the release manager is fixed.
Russia ☭ forever, Viacheslav N. Mezentsev
Hi Uni,
May I come to you with a small proposal concerning this excellent plugin.
My proposal concerns the "Shapes Drawings". Would it be possible to fill a polygon also with transparent collors ?
Thanks a lot and best Regards,
Ioan
May I come to you with a small proposal concerning this excellent plugin.
My proposal concerns the "Shapes Drawings". Would it be possible to fill a polygon also with transparent collors ?
Thanks a lot and best Regards,
Ioan
Do to others as you would like them to do to you! Knowledge is of no value unless you put it into practice - Chekhov
What's wrong with this method? You can always use transparency. Color format: #ARGB.
Russia ☭ forever, Viacheslav N. Mezentsev
1 пользователям понравился этот пост
sergio 13.08.2024 15:41:00
Thanks for your answer.
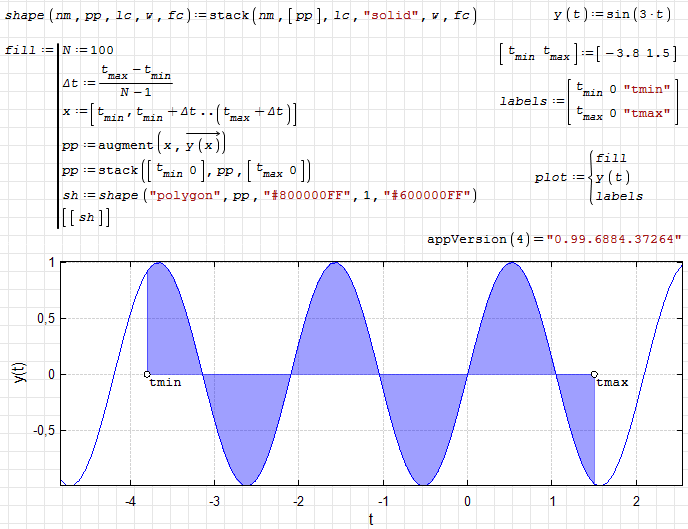
Here is my application's result:
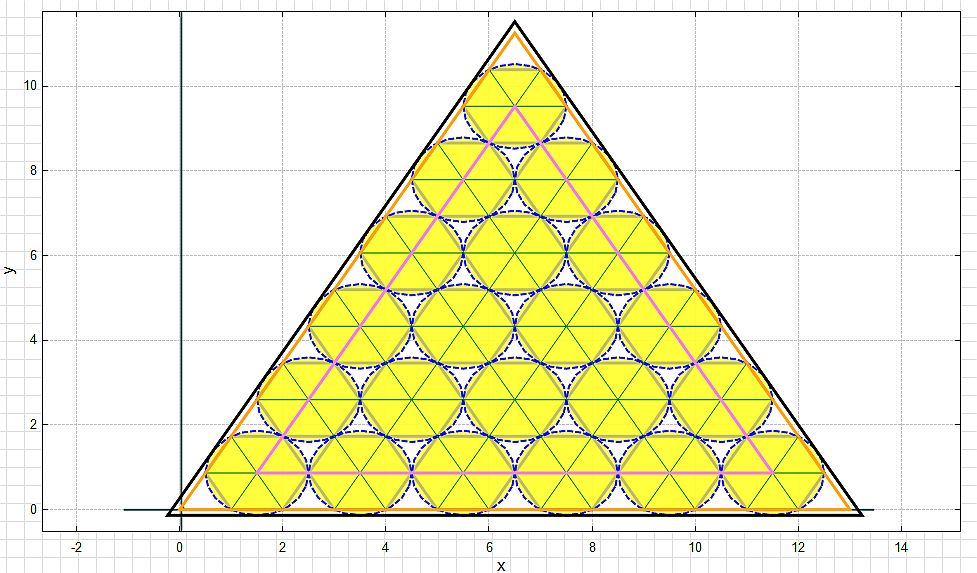
Here is my application's result:
Do to others as you would like them to do to you! Knowledge is of no value unless you put it into practice - Chekhov
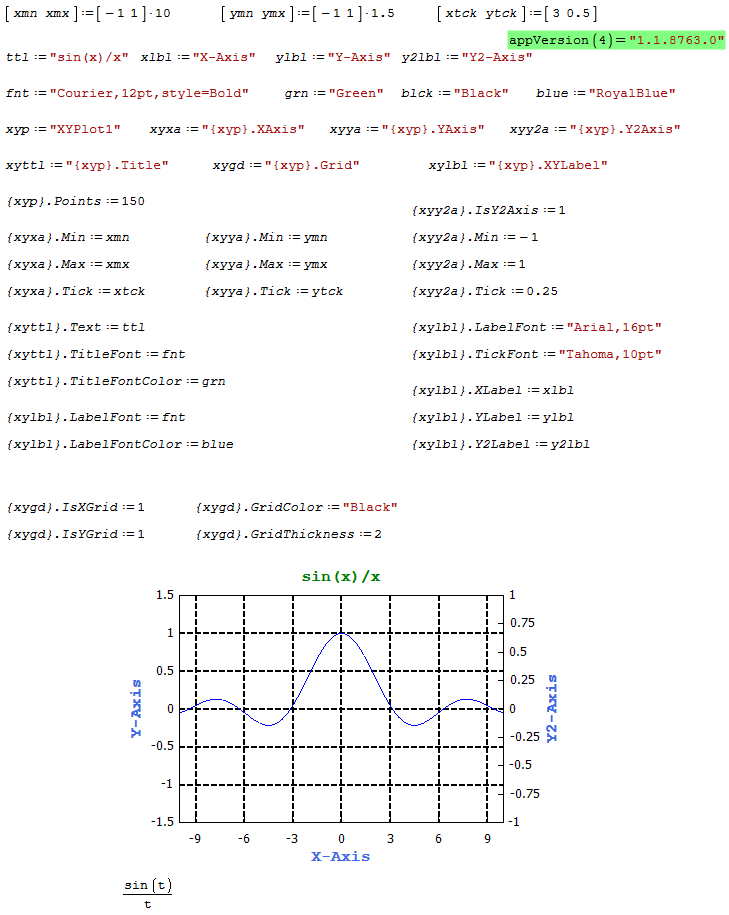
Plugin updated. Ctrl+Shift+K for special symbols ( '.','{','}' ).
Changes:
- added a simplified version of setting properties;
- added support for nesting for easier property setting;
- simplified nested example added.
Russia ☭ forever, Viacheslav N. Mezentsev
4 пользователям понравился этот пост
sergio 13.08.2024 15:38:00, ioan92 13.08.2024 13:40:00, churichuro 15.08.2024 01:36:00, zhkz 13.08.2024 20:30:00
Wrote


Plugin updated. Ctrl+Shift+K for special symbols ( '.','{','}' ).
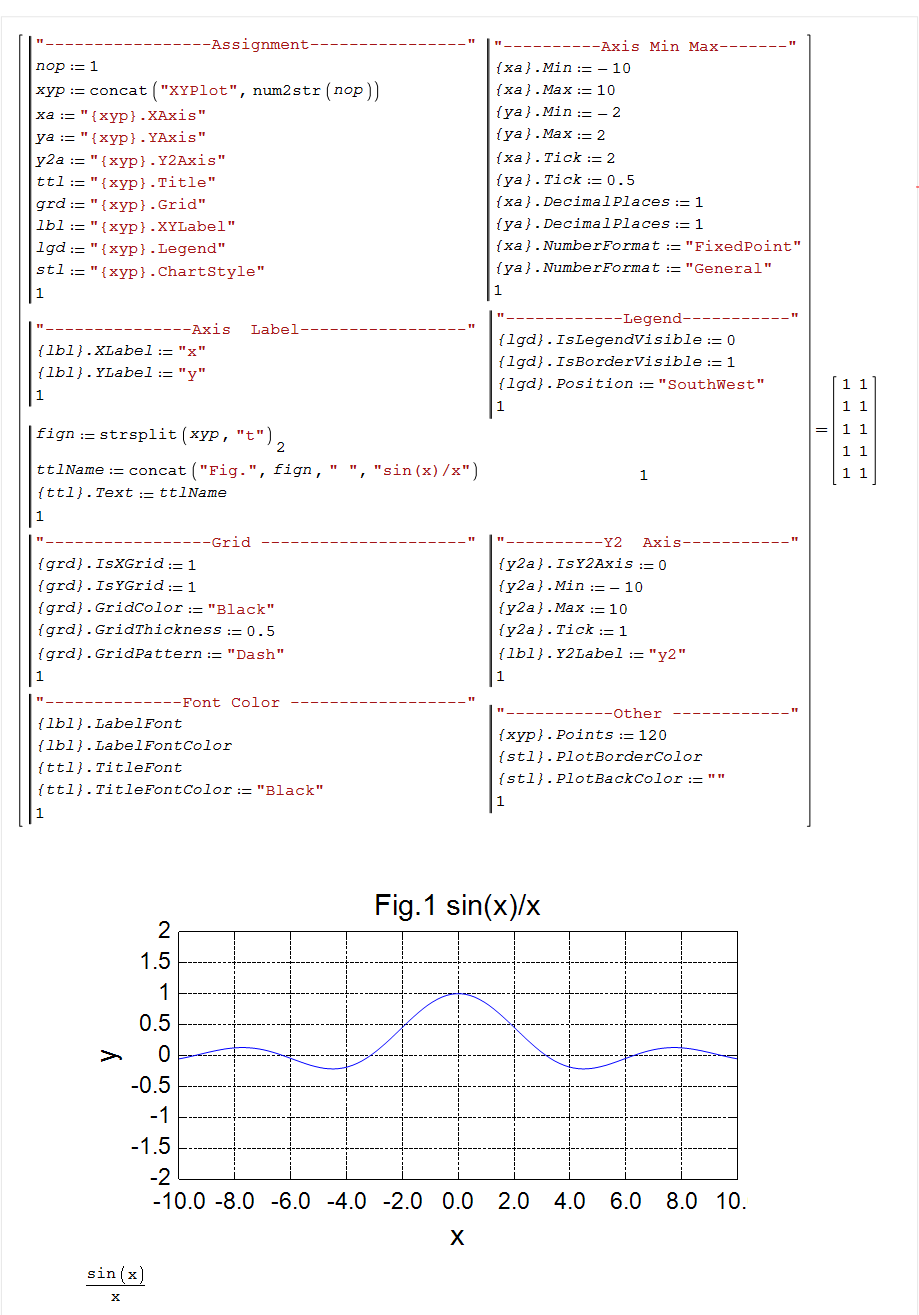
thanks uni , it's so convenient to set properties for figures now ,
i wil attach my usage for late-comers to reference .
i decide to make it be a snippet , whenever there is a xyplot i'll insert this snippet

my sm file is at: simplifed_setprop.sm (13,06 КиБ) скачан 1420 раз(а).
3 пользователям понравился этот пост
From now the old ways of managing the plot settings from the document will be considered obsolete. In the future, I will disable and remove them.
I might remove the curly braces on the left. They're not really necessary. Right now, the source code from the setprop() function is used.
I might remove the curly braces on the left. They're not really necessary. Right now, the source code from the setprop() function is used.
Russia ☭ forever, Viacheslav N. Mezentsev
I'd propose to add an option to send the current settings of a plot to the clipboard as math regions. Then the user can paste this to the sheet and delete/modify as needed.
Technische Mechanik mit SMath Studio: https://link.springer.com/book/10.1007/978-3-658-50592-9
2 пользователям понравился этот пост
As an experiment, I may add this feature.
Russia ☭ forever, Viacheslav N. Mezentsev
1 пользователям понравился этот пост
Davide Carpi 13.09.2024 05:57:00
- Новые сообщения
- Нет новых сообщений