
1 pagine (3 elementi)
How can I use the plotG funciton? - cannot find plotG - Messaggi

Hello, I read SMathPrimer. I saw that there is a function named plotG and made available by Radovon Omorjan in SMath Studio Forum. I searched but couldn't find it. Can you please help me about this subject? Should I install it? Should I enter a code? Where can I find it?
1 utenti hanno apprezzato questo post
Radovan Omorjan 07/02/2018 04:50:00

Hello,
I do not know why I deserved the credits for this character plotting in the native SMath plot. I think this is purely by accident because Andrey Ivashov made this possible long time ago and he personally wrote the first version of this function. I just happened to be one of the first users who used it. Here is the simple self explained example and anyone can use it as a template and modify it as desired. This time I borrowed the version from one of the Jean Giraud examples . You can see many of the Jean's examples where he used it extensively.
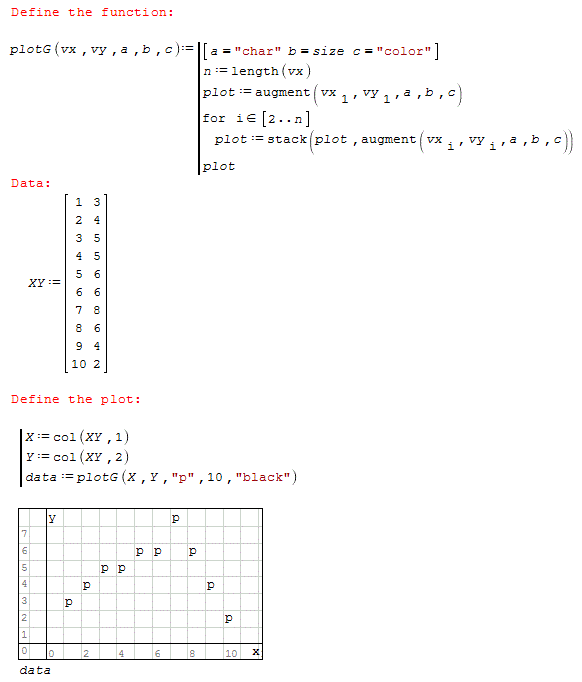
The answer to the question is that you have to just make this function available in your worksheet i.e. copy/paste from another one, make a snippet etc.
Regards,
Radovan
I do not know why I deserved the credits for this character plotting in the native SMath plot. I think this is purely by accident because Andrey Ivashov made this possible long time ago and he personally wrote the first version of this function. I just happened to be one of the first users who used it. Here is the simple self explained example and anyone can use it as a template and modify it as desired. This time I borrowed the version from one of the Jean Giraud examples
. You can see many of the Jean's examples where he used it extensively. The answer to the question is that you have to just make this function available in your worksheet i.e. copy/paste from another one, make a snippet etc.
Regards,
Radovan
When Sisyphus climbed to the top of a hill, they said: "Wrong boulder!"
1 utenti hanno apprezzato questo post
frapuano 07/02/2018 08:48:00
WroteHello, I read SMathPrimer. I saw that there is a function named plotG and made available by Radovon Omorjan in SMath Studio Forum. I searched but couldn't find it. Can you please help me about this subject? Should I install it? Should I enter a code? Where can I find it?
From recollection, this function is from Martin Handbook.
1. Most used char: o, +,. [too low size is not visible]
2. colors: red, green, blue ... by names or any of the web color code.
3. PlotG(,,,,,) is slow, immaterial is low population [typical < 100]
4. pts(data,spec) is about 12 times faster.
Enjoy Smath Community.
Genfit Viscosity Water.sm (37,16 KiB) scaricato 1247 volta(e).
Random_8 Fill Critical Region.sm (14,16 KiB) scaricato 1250 volta(e).
1 utenti hanno apprezzato questo post
sergio 07/02/2018 15:19:00
1 pagine (3 elementi)
- Nuovi post
- Nessun nuovo post