Graphing a function, but I cannot adjust the axes limits

Graphing a function, but I cannot adjust the axes limits - Title. - Messaggi

#1 Pubblicato: 01/08/2024 11:49:35
ALLAN PAOLO LABARTINOS ALMAJOSE

ALLAN PAOLO LABARTINOS ALMAJOSE

0 apprezzamenti in 1 post.

Gruppo: User

I am completely aware that the documentation said that you cannot adjust the axes limits when using vanilla plot function. Is there a plugin that is able to resolve this issue?

Or rephrasing; is there an available plugin that allows users to plot functions and adjust the axes limits of the plot?

TYIA.
#2 Pubblicato: 01/08/2024 18:38:01
overlord

overlord

600 apprezzamenti in 1.381 post.

Gruppo: Moderator

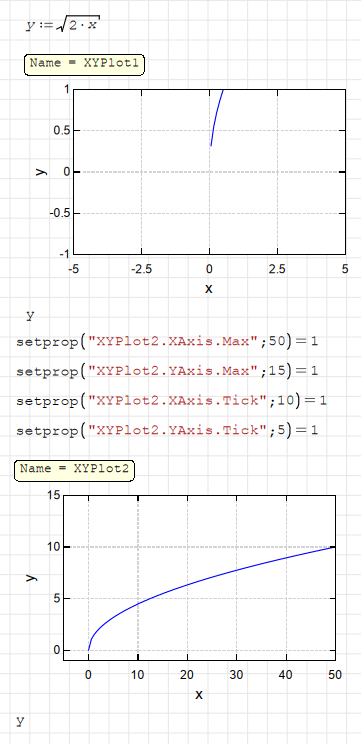
You can use XYPlot and setprop() function for that purpose.
Here is sample file for setprop function.

Regards

setprop.sm (21,36 KiB) scaricato 1650 volta(e).

2024-08-01_14-33.png
1 utenti hanno apprezzato questo post
ioan92 02/08/2024 14:33:00
#3 Pubblicato: 07/08/2024 22:03:13
⚜ Kenny Lemens, P.E. ᵂᴵ

⚜ Kenny Lemens, P.E. ᵂᴵ

85 apprezzamenti in 181 post.

Gruppo: User

Greetings,

As a note: the 'name' of the graph (in this case XYPlot1 and XYPlot2) is specified via the XY-Plot Properties (i.e., double-click the graph to see the full list of properties); one of those fields is called "Name" which would be the title to reference the Plot through the 'setprop()' command.


May this be of Good Help;
⚜ Kenny Lemens, P.E. ᵂᴵ
"No matter where you go, there you are." -Buckaroo BanzaiHotkeys: https://en.smath.com/forum/resource.ashx?a=45771&b=2
  • Nuovi post
  • Nessun nuovo post