
1 pagine (6 elementi)
XY plot issues - Messaggi

X right range does not show
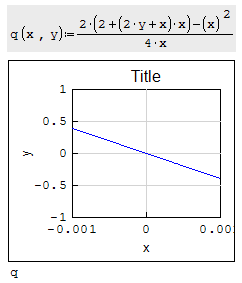
X_Y plot does not like big numbers. It first refused the max X
with several error messages that I couldn't clear but waited
several minutes ... bingo ! Same topo for the low limit no response
error mesage ... same topo for the thick. It must have taken 10 min.
Maybe X_Y plot does not have enough fingers to count up to 1000000.
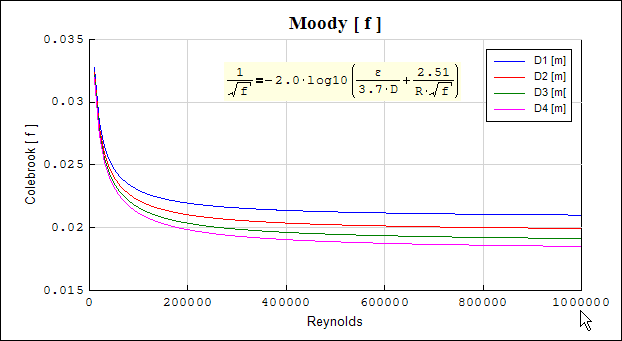
with several error messages that I couldn't clear but waited
several minutes ... bingo ! Same topo for the low limit no response
error mesage ... same topo for the thick. It must have taken 10 min.
Maybe X_Y plot does not have enough fingers to count up to 1000000.
I don't understand why X_Y does not like stuff directly from Smath.
27 min reduced to 1.2 min... quite a big peanut !
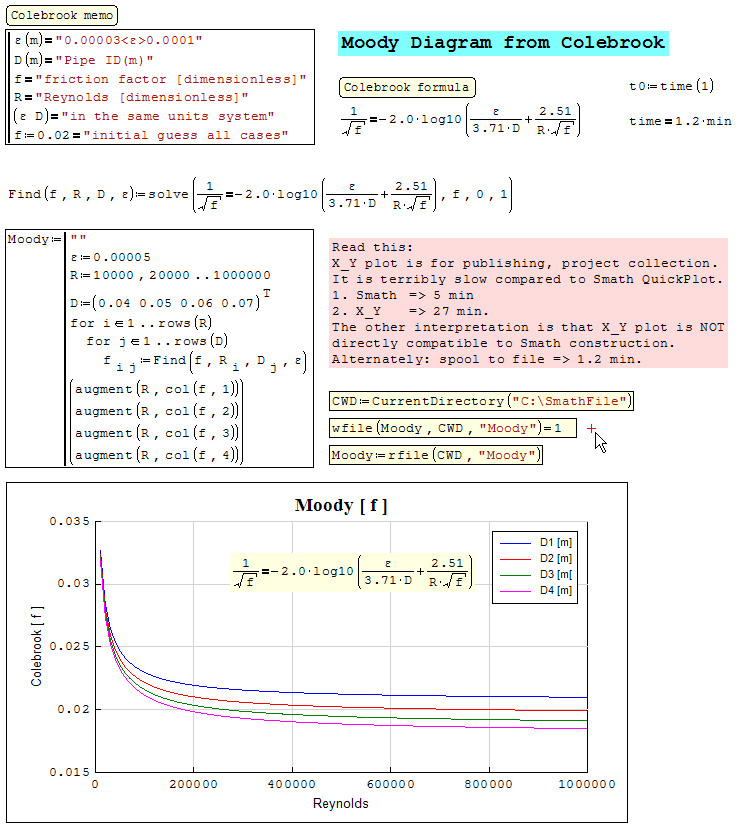
27 min reduced to 1.2 min... quite a big peanut !
WroteI don't understand why X_Y does not like stuff directly from Smath.
27 min reduced to 1.2 min... quite a big peanut !
Could you please post the .SM workbook? Would like to tinker around abit..
Try replacing your Moody:=line(...) with Moody:=eval(line(...)).
Hope this helps. Is it does, then the problem is symbolic optimization, that causes re-evaluation each time a plugin needs some value.
Hope this helps. Is it does, then the problem is symbolic optimization, that causes re-evaluation each time a plugin needs some value.
С уважением,
Михаил Каганский
Ok, I tried to reproduce your observations.
1. I don't understand what do you mean by the topic title "Maxima X_Y plot". AFAIK, there's only plain "X-Y Plot Region" plugin, and I don't see any Maxima usage in your posts here.
2. You didn't show the input data for the plot, but I assume you used sys(Moody[1;Moody[2;...), not just Moody, because you have four series, not one. (Not that this is wrong, just this is essential for understanding).
I see the problem you describe (I think so) in my attached file: Moody.sm (14,84 KiB) scaricato 1354 volta(e).
There, if I enable block with eval(), on my PC it takes just ~15 s (I take it as x1) to calculate, and plot is done ~instantly.
Without eval(), if I plot simply Moody (no 4 series), then the plot takes ~30 s [x2].
Plotting sys(Moody[1;Moody[2;...) takes ~300 s [x20].
This timing is somewhat consistent with your data (when you write to file, it takes 1.2 min (x1) - without this, it takes 22 times longer).
Yes, seems like plugin isn't optimized here, but anyway, I would expect the best possible result (using your approach without eval()) to be no better than 60 s (x4), because you use symbolic evaluated variable four times in your sys. Thus, I would DEFINITELY recommend use eval in this case.
1. I don't understand what do you mean by the topic title "Maxima X_Y plot". AFAIK, there's only plain "X-Y Plot Region" plugin, and I don't see any Maxima usage in your posts here.
2. You didn't show the input data for the plot, but I assume you used sys(Moody[1;Moody[2;...), not just Moody, because you have four series, not one. (Not that this is wrong, just this is essential for understanding).
I see the problem you describe (I think so) in my attached file: Moody.sm (14,84 KiB) scaricato 1354 volta(e).
There, if I enable block with eval(), on my PC it takes just ~15 s (I take it as x1) to calculate, and plot is done ~instantly.
Without eval(), if I plot simply Moody (no 4 series), then the plot takes ~30 s [x2].
Plotting sys(Moody[1;Moody[2;...) takes ~300 s [x20].
This timing is somewhat consistent with your data (when you write to file, it takes 1.2 min (x1) - without this, it takes 22 times longer).
Yes, seems like plugin isn't optimized here, but anyway, I would expect the best possible result (using your approach without eval()) to be no better than 60 s (x4), because you use symbolic evaluated variable four times in your sys. Thus, I would DEFINITELY recommend use eval in this case.
С уважением,
Михаил Каганский
1 pagine (6 elementi)
- Nuovi post
- Nessun nuovo post