
1 páginas (14 elementos)
Multiple lines on same graph - generated in a loop - Mensajes

Hello,
I am trying to plot multiple lines on the same graph. I understood in the plot region I can insert the "multiple values" placeholder and add the different functions to be plotted there.
But what if I want 100 functions to be plotted? Do I have to add all of them manually in the placeholders, or does this possibility exists in Smath Studio?
In matlab I would do something like
x=vector between 0 and pi
for i:0; i<100; i++
{
for j=0; j< length(x); j++
{
matrix(i,j)=i*sin(x);
}
plot(x,matrix(i))
}
Thank you
Marco
I am trying to plot multiple lines on the same graph. I understood in the plot region I can insert the "multiple values" placeholder and add the different functions to be plotted there.
But what if I want 100 functions to be plotted? Do I have to add all of them manually in the placeholders, or does this possibility exists in Smath Studio?
In matlab I would do something like
x=vector between 0 and pi
for i:0; i<100; i++
{
for j=0; j< length(x); j++
{
matrix(i,j)=i*sin(x);
}
plot(x,matrix(i))
}
Thank you
Marco

Hello Marco,
This is easy. Just use a linear indexing assignment on a system (Look at the attachment).
Best regards,
Davide
Multiple plots.sm (9,56 KiB) descargado 1515 vez(es).
This is easy. Just use a linear indexing assignment on a system (Look at the attachment).
Best regards,
Davide
Multiple plots.sm (9,56 KiB) descargado 1515 vez(es).
If you like my plugins please consider to support the program buying a license; for personal contributions to me: paypal.me/dcprojects
grazieeeeee!!!
(thanks)
What if I want to plot with custom horizontal axis? that is building a specific horizontal axis vector?
what I am doing is clearly wrong
Marco
Multiple plots - wrong.sm (3,88 KiB) descargado 1477 vez(es).
(thanks)
What if I want to plot with custom horizontal axis? that is building a specific horizontal axis vector?
what I am doing is clearly wrong
Marco
Multiple plots - wrong.sm (3,88 KiB) descargado 1477 vez(es).
Di nulla (you're welcome) 
Updated with domains and matrices.
Davide
Updated with domains and matrices.
Davide
If you like my plugins please consider to support the program buying a license; for personal contributions to me: paypal.me/dcprojects
just saw your editing...Thanks again
If you are interested on techniques to plot axis, you can see also this example made by oscampo
If you like my plugins please consider to support the program buying a license; for personal contributions to me: paypal.me/dcprojects
thanks, I had the bode plot example. Didn't have time to try to understand it yet.
btw, how did you insert the range? What is the horizontal line and how do I get it? (I tried with the fraction "/" ... fail!)
btw, how did you insert the range? What is the horizontal line and how do I get it? (I tried with the fraction "/" ... fail!)
To have the range(2) function type range and press tab; to have he range(3)
function press the argument separator key inside a range(2) placeholder or select the range(3) function from the dynamic assistance.
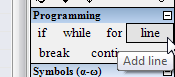
To have the line(#) function type line and press tab, press the argument separator key to have more lines. You may also use the line button in the Programming palette on the right.
The number inside the parentheses is the arguments' number of the function (# means undefined)
function press the argument separator key inside a range(2) placeholder or select the range(3) function from the dynamic assistance.
To have the line(#) function type line and press tab, press the argument separator key to have more lines. You may also use the line button in the Programming palette on the right.
The number inside the parentheses is the arguments' number of the function (# means undefined)
If you like my plugins please consider to support the program buying a license; for personal contributions to me: paypal.me/dcprojects
sorry I meant the domain.
I was talking about the horizontal line under i*sin(x), where you wrote 0
I was talking about the horizontal line under i*sin(x), where you wrote 0
Ahhh... the horizontal line is a simple fraction / 
You can add the domain limiter:
- to the numerator, if you want to see a null value outside the domain;
- to the denominator, otherwise.
Booleans result is 0 for false and 1 for true, so [math eng]something/0[/math] is not visible.
The ternary boolean operator under the line is part of the Functions' Extension plugin, following the link in the attachments of the first post you can see the syntax (in the example above I've used ltlt and tab)
You can add the domain limiter:
- to the numerator, if you want to see a null value outside the domain;
- to the denominator, otherwise.
Booleans result is 0 for false and 1 for true, so [math eng]something/0[/math] is not visible.
The ternary boolean operator under the line is part of the Functions' Extension plugin, following the link in the attachments of the first post you can see the syntax (in the example above I've used ltlt and tab)
If you like my plugins please consider to support the program buying a license; for personal contributions to me: paypal.me/dcprojects
ok thanks again.
I am missing something.
If I type at the denominator
0
if I copy from your original file 0
Multiple plots - wrong2.sm (6,13 KiB) descargado 1477 vez(es).
I am missing something.
If I type at the denominator
0
if I copy from your original file 0
Multiple plots - wrong2.sm (6,13 KiB) descargado 1477 vez(es).
Yes
because when you type < < you obtain [math eng]#<#<#[/math] that seems a ternary operator but is just a boolean less nested inside another boolean less; using parentheses indeed is [math eng]((#<#)<#)[/math], so in the end you have [math eng]((0
Without plugins booleans AND/OR are needed, as shown in my first post: [math eng](0
because when you type < < you obtain [math eng]#<#<#[/math] that seems a ternary operator but is just a boolean less nested inside another boolean less; using parentheses indeed is [math eng]((#<#)<#)[/math], so in the end you have [math eng]((0
Without plugins booleans AND/OR are needed, as shown in my first post: [math eng](0
If you like my plugins please consider to support the program buying a license; for personal contributions to me: paypal.me/dcprojects
1 páginas (14 elementos)
- Nuevos mensajes
- Sin mensajes nuevos