
Drawings in SMath - Mensajes

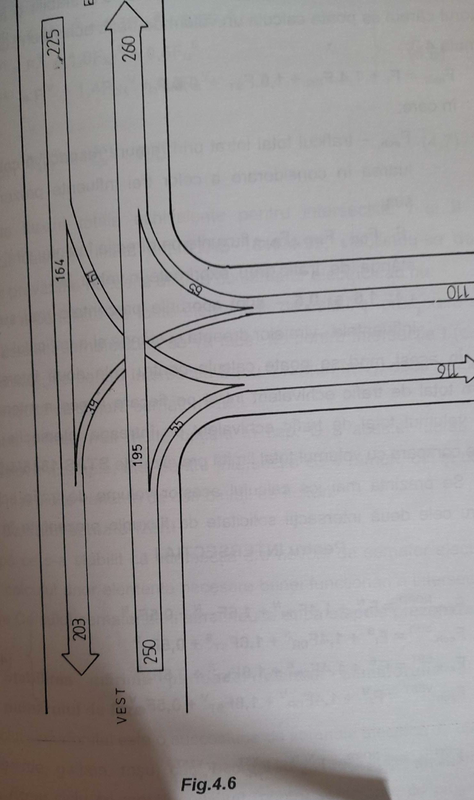
I have to draw this cartigrans ,within these cartograms, the volume of flows is represented at an equivalent scale (eg 100 veh. = 1 mm width) of strips with width proportional to the flow volume.
Thank you!
- X-Y Plot plugin (explicit, parametric and implicit plots, polygons, geometric shapes, see https://doi.org/10.25933/opus4-2948)
- Maxima Draw (requires Maxima plugin, see https://doi.org/10.25933/opus4-2949)
- Modeller region (allows for graphical interactive input but is not easy to understand. See the Beam-FEA-example in the Extension manager)
Note that neither of these approaches works in the cloud version.
WroteThere are multiple ways to create variable-controlled graphics. The most advanced ones are
- X-Y Plot plugin (explicit, parametric and implicit plots, polygons, geometric shapes, see https://doi.org/10.25933/opus4-2948)
- Maxima Draw (requires Maxima plugin, see https://doi.org/10.25933/opus4-2949)
- Modeller region (allows for graphical interactive input but is not easy to understand. See the Beam-FEA-example in the Extension manager)
Note that neither of these approaches works in the cloud version.
Thank you for the information. I will do a read as i might need this in the future, for now i solved it by pasting an image and puting values over it
 . Since 1mm is not a big deal and hard to notice.
WroteThere are multiple ways to create variable-controlled graphics. The most advanced ones are
- X-Y Plot plugin (explicit, parametric and implicit plots, polygons, geometric shapes, see https://doi.org/10.25933/opus4-2948)
- Maxima Draw (requires Maxima plugin, see https://doi.org/10.25933/opus4-2949)
- Modeller region (allows for graphical interactive input but is not easy to understand. See the Beam-FEA-example in the Extension manager)
Note that neither of these approaches works in the cloud version.
Thank you for the response. I will look into it
- Nuevos mensajes
- Sin mensajes nuevos