
1 páginas (9 elementos)
picewise quadratic fit - maybe a newbie question.. - Mensajes

hello everyone,
i want to fit a list of data points by picewise quadratic function like this,
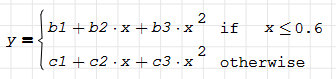
where 0.6 is the break point that i chose in advance .
the requirements are:
1. the function and its first derivetive at the break point should be continuous,
2. the break point is not known thus is also a parameter to fit.
(but in my data points, i wold like to choose 0.6 as breakpoint in advance )
this picewise quadratic is taken from a empirial expression , so it's not appropriate to take other function forms
The Fit function provided by Maxima plugin seems can not do that:
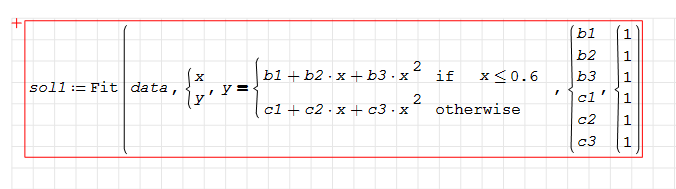
any suggestion is welcomed, the .sm file is attatched for the datapoints
thanks in advance.
picewise_qudratic_fit.sm (14,18 KiB) descargado 1599 vez(es).
i want to fit a list of data points by picewise quadratic function like this,
where 0.6 is the break point that i chose in advance .
the requirements are:
1. the function and its first derivetive at the break point should be continuous,
2. the break point is not known thus is also a parameter to fit.
(but in my data points, i wold like to choose 0.6 as breakpoint in advance )
this picewise quadratic is taken from a empirial expression , so it's not appropriate to take other function forms
The Fit function provided by Maxima plugin seems can not do that:
any suggestion is welcomed, the .sm file is attatched for the datapoints
thanks in advance.
picewise_qudratic_fit.sm (14,18 KiB) descargado 1599 vez(es).
Maxima isn't required! See the attached. (This simple approach isn't quite continuous at the cross-over point, though it would be if you had chosen x = 0.555).
picewise_qudratic_fit_b.sm (20,55 KiB) descargado 1481 vez(es).
picewise_qudratic_fit_b.sm (20,55 KiB) descargado 1481 vez(es).
A 1 usuarios les gustó este mensaje
Alvaro 15/12/2023 13:58:00
I want to fit a list of data points by picewise quadratic function
the requirements are:
1. the function and its first derivative at the break point should be continuous,
2. the break point is not known thus is also a parameter to fit.
................
Quadratic joins at support points automated wrt X vector.
Quadratic derivative can't be smooth at junctions.
Only cubic derivative is smooth at junctions.
Jean
Worksheet30.sm (32,95 KiB) descargado 1564 vez(es).
the requirements are:
1. the function and its first derivative at the break point should be continuous,
2. the break point is not known thus is also a parameter to fit.
................
Quadratic joins at support points automated wrt X vector.
Quadratic derivative can't be smooth at junctions.
Only cubic derivative is smooth at junctions.
Jean
Worksheet30.sm (32,95 KiB) descargado 1564 vez(es).
Wrotethough it would be if you had chosen x = 0.555).
picewise_qudratic_fit_b.sm (20,55 KiB) descargado 1481 vez(es).
thanks for your solution , but even though at 0.555 , the first derivative is not continuous
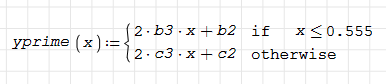
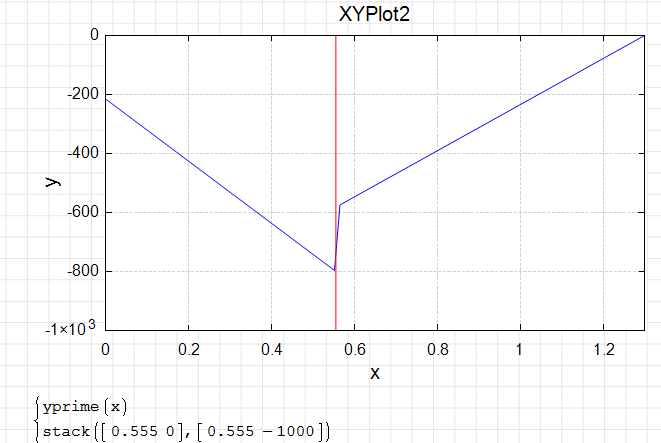
maybe the first derivative continuity of quadratic function at joint point can not be achieved in theory as Jean Giraud said , though the empirial expression I refer to does have continuity at joint point, the empirial expression ,which only needs the max y value , the min y value and a paticular x value , can give the picewice qudratic function , as below
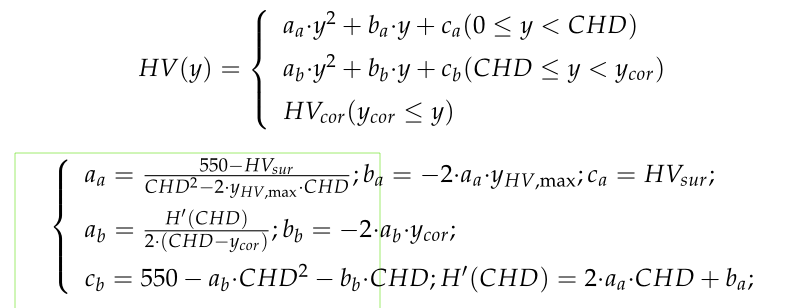
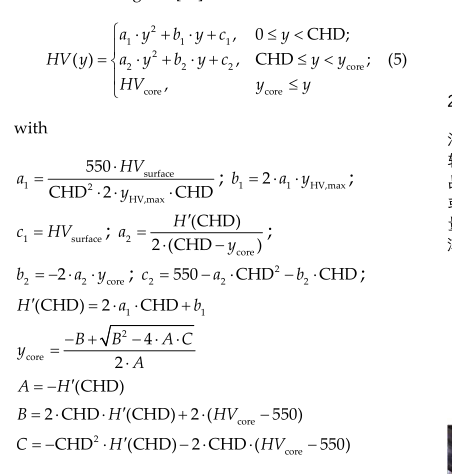
the below figure have some typos in formula of a1 and b1 ,the above figue is correct
well i think it must have some additonal constraint conditon to achieve that.
if intrested , you can find this empirial function at :
[1] Li X, Shao W, Tang J, et al. An Investigation of the Contact Fatigue Characteristics of an RV Reducer Crankshaft, Considering the Hardness Gradients and Initial Residual Stress[J]. Materials, 2022, 15(21): 7850.
[2] Wang W, Liu H, Zhu C, et al. Evaluation of contact fatigue risk of a carburized gear considering gradients of mechanical properties[J]. Friction, 2020, 8(6): 1039-1050.
WroteMaxima isn't required! See the attached. (This simple approach isn't quite continuous at the cross-over point, though it would be if you had chosen x = 0.555).
picewise_qudratic_fit_b.sm (20,55 KiB) descargado 1481 vez(es).
Hi. I just take the excelent Stv work and add some basic maths.
picewise_qudratic_fit_b.sm (30,99 KiB) descargado 1470 vez(es).
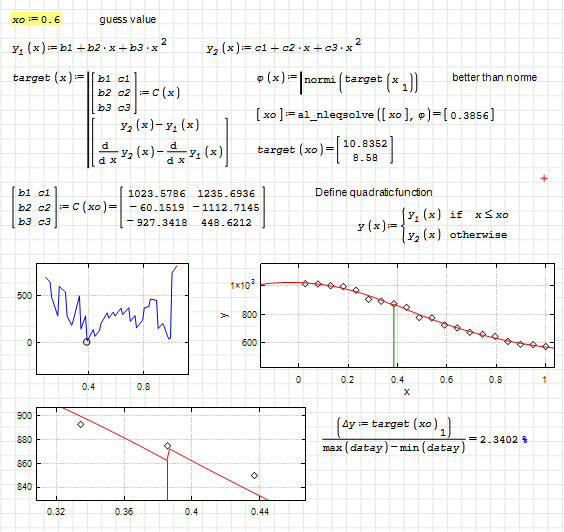
Best regards.
Alvaro.
Thank you all guys and have a nice day, looks like I'll have to accept the fact that the jump point derivatives are discontinuous.
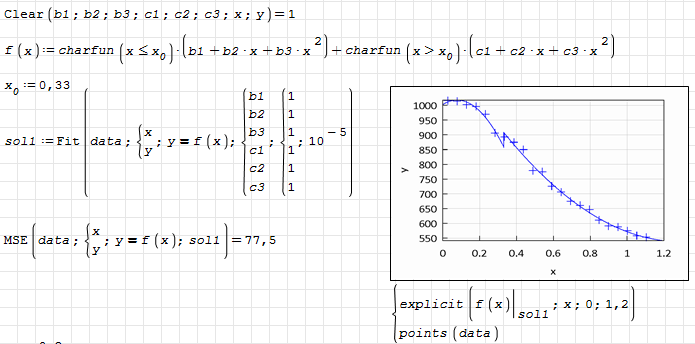
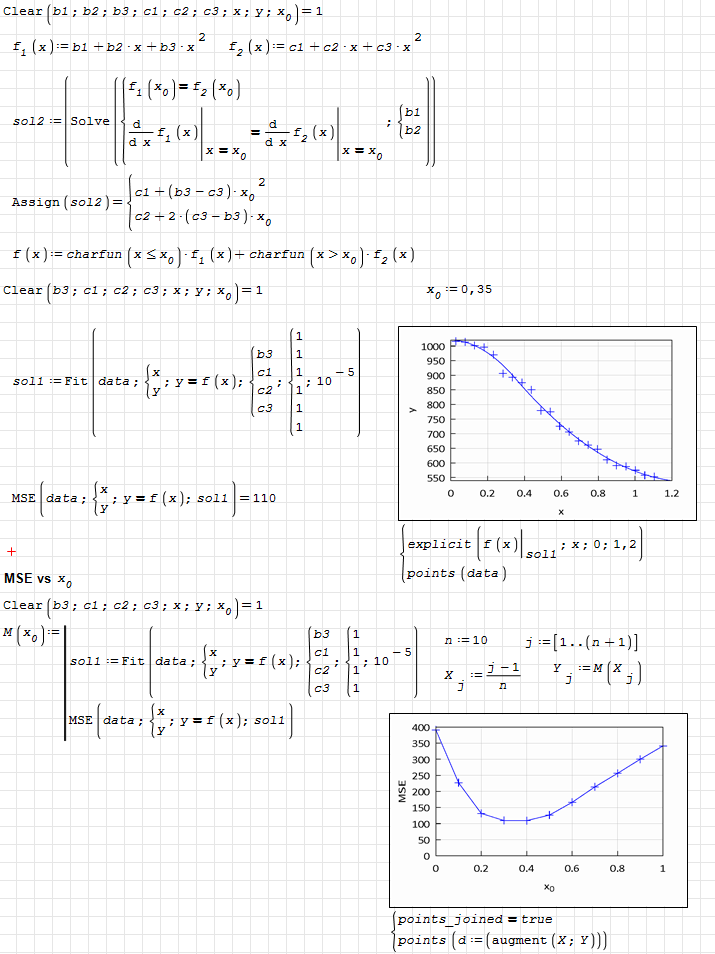
General remark for Fit():
- names for the variables and the parameters must be undefined. Use Clear for repeated fits if assignment was used.
- You can do the fit, evaluate the mean square error and plot the function without actually assigning the variables.
- Sometimes the default precision is not sufficient, then it is advisable to reduce the tolerance (optional argument)
For piecewise functions, use conditionals wrapped in charfun(). In Maxima conditionals evaluate to true or false, charfun() converts that to 1 or 0, so you can do arithmetics and plotting
If you want continuity between the functions, use the conditions to eliminate some parameters symbolically. This enforces these conditions exactly.
For the discontinuous independent functions, the fit can't include x.0 because the target function's dependence on x.0 is piecewise constant between data points. x.0 essentially assigns the data points to the independent fit ranges. So the derivative is zero or undefined, which Fit() can't handle.
For the continuous fit, the inclusion of x.0 as fit variable also fails but with less obvious reason, at least the derivatives of the error wrt x.0 should not be zero between data points.
picewise_qudratic_fit_Kr.sm (82,13 KiB) descargado 1547 vez(es).
- names for the variables and the parameters must be undefined. Use Clear for repeated fits if assignment was used.
- You can do the fit, evaluate the mean square error and plot the function without actually assigning the variables.
- Sometimes the default precision is not sufficient, then it is advisable to reduce the tolerance (optional argument)
For piecewise functions, use conditionals wrapped in charfun(). In Maxima conditionals evaluate to true or false, charfun() converts that to 1 or 0, so you can do arithmetics and plotting
If you want continuity between the functions, use the conditions to eliminate some parameters symbolically. This enforces these conditions exactly.
For the discontinuous independent functions, the fit can't include x.0 because the target function's dependence on x.0 is piecewise constant between data points. x.0 essentially assigns the data points to the independent fit ranges. So the derivative is zero or undefined, which Fit() can't handle.
For the continuous fit, the inclusion of x.0 as fit variable also fails but with less obvious reason, at least the derivatives of the error wrt x.0 should not be zero between data points.
picewise_qudratic_fit_Kr.sm (82,13 KiB) descargado 1547 vez(es).
Technische Mechanik mit SMath Studio: https://link.springer.com/book/10.1007/978-3-658-50592-9
Wrotehello everyone,
I see 3 plots, 3 correct plots but wrong.
Wrong ... explain:
plot 1000 points to get nice vertical discontinuity.
Jean
WroteI see 3 plots, 3 correct plots but wrong.
Wrong ... explain:
plot 1000 points to get nice vertical discontinuity.
Jean
Worksheet66.sm (5,98 KiB) descargado 1563 vez(es).
1 páginas (9 elementos)
- Nuevos mensajes
- Sin mensajes nuevos