
1 páginas (7 elementos)
How to show specific lables on axis in logarithmic plot? - Mensajes

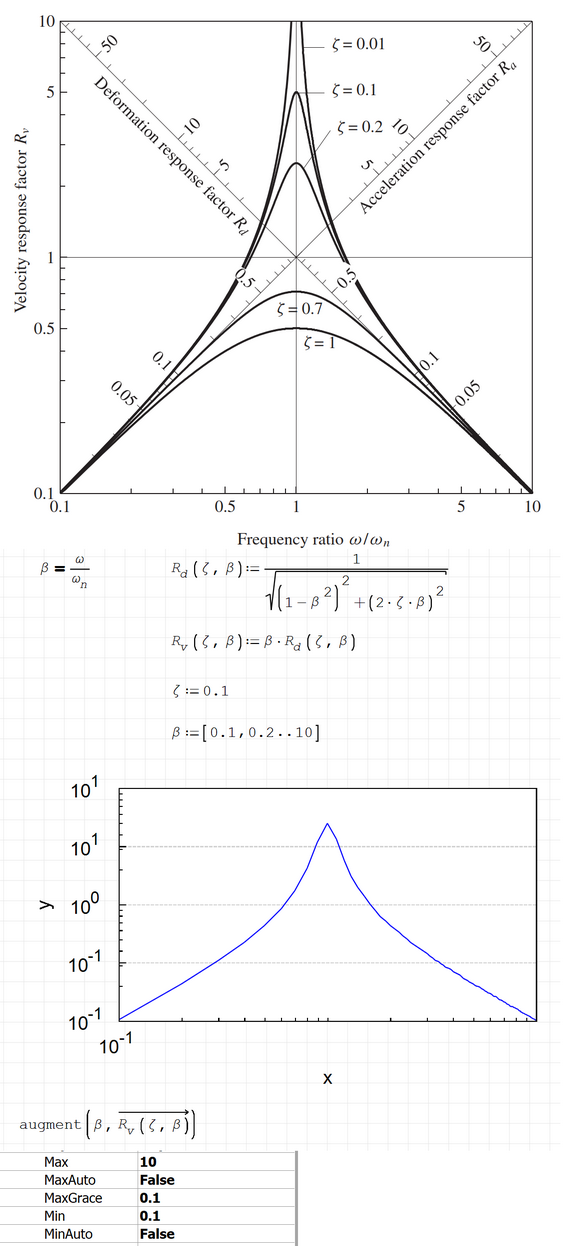
The logarithmic plot on the top of the image shows 0.1, 0.5, 1, 5 and 10 on both x and y axis (log scale).
I insert a Zedgraph, and set 0.1 to min and 10 to max, as shown in the image.
But the lables on Y axis has two 10^-1 and two 10^1, while lables on X axis has only one 10^-1.
How to show 0.1, 0.5, 1, 5 and 10 on both x and y axis?
PS. The two 45 degree axises for Rd and Ra on the top image are ingored in Smath.
Worksheet2.sm (36,09 KiB) descargado 1330 vez(es).
Too many things are missing in there !
Which things are missing?
WroteWhich things are missing ?
These two work well.
2DPlots ZedGraph log-log.sm (99,81 KiB) descargado 1308 vez(es).
Laplace Admittance.sm (153,39 KiB) descargado 1333 vez(es).

Greetings,
I would encourage you to review Overlord's post on the following forum: https://en.smath.com/forum/yaf_postsm70646_XY-PLOT-Logarithmic-scale.aspx#post70646
In the case you cannot format the axis labels as you so desire, you also have the ability/option to insert text and draw lines on the graph; thus creating your own axis data (technically plotted data, but it would appear as expected). On that note, you can also draw in those lines at the 45°; just need to draw a line with regards to your axes being calibrated in log cycles: (https://geology.humboldt.edu/courses/geology531/531_handouts/equations_of_graphs.pdf)
Hope this helps!
-Kenny Lemens, P.E. ᵂᴵ
I would encourage you to review Overlord's post on the following forum: https://en.smath.com/forum/yaf_postsm70646_XY-PLOT-Logarithmic-scale.aspx#post70646
- In short, you might want to consider the use of the 「X-Y Plot Region」 Plugin might serve you better than 「Zedgraph」.
In the case you cannot format the axis labels as you so desire, you also have the ability/option to insert text and draw lines on the graph; thus creating your own axis data (technically plotted data, but it would appear as expected). On that note, you can also draw in those lines at the 45°; just need to draw a line with regards to your axes being calibrated in log cycles: (https://geology.humboldt.edu/courses/geology531/531_handouts/equations_of_graphs.pdf)
Hope this helps!
-Kenny Lemens, P.E. ᵂᴵ
"No matter where you go, there you are." -Buckaroo BanzaiHotkeys: https://en.smath.com/forum/resource.ashx?a=45771&b=2
WroteI would encourage you to review Overlord's post on the following forum:
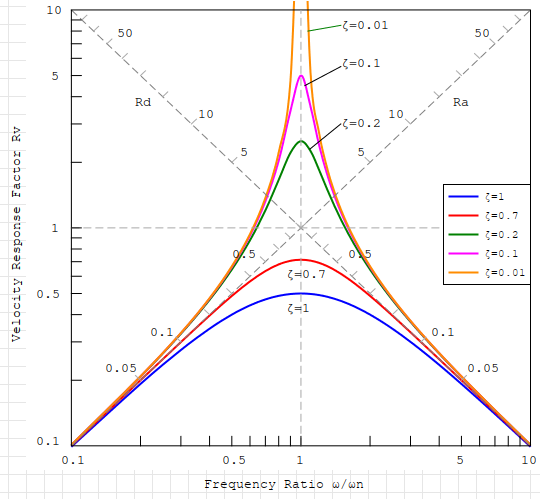
I don't know how to easily rotate text in XYPlot or even it is possible.
But a lot of portion of your function can be plotted by mentioned method.
I am not sure accuracy of crossline ticks however.
I only implemented it to show this can be done.
Regards
PS: Refreshed with spline plots.
Worksheet2.sm (34,89 KiB) descargado 1403 vez(es).
A 5 usuarios les gustó este mensaje
NDTM Amarasekera 19/1/2023 23:22:00, Alvaro 19/1/2023 23:55:00, bdrunagle 20/1/2023 4:24:00, churichuro 20/1/2023 12:29:00, netsonicyxf 6/7/2023 23:53:00
1 páginas (7 elementos)
- Nuevos mensajes
- Sin mensajes nuevos