
X-Y Plot Region - Extends SMath Studio with a X-Y Plot Region. - Mensajes

Many thanks to Viacheslav. It works fine now.
Look within!... The secret is inside you.
Best Regards
Eng. NDTM Amarasekera - Sri Lanka

CitarPlease, could you make a list with the external names of parameters.
I think that we need a special function to change the settings. Something like this: xyplot( index, "parameter's name", value) = .... I will try to add this feature.
Russia ☭ forever, Viacheslav N. Mezentsev
A 2 usuarios les gustó este mensaje

Ah !, Martin: you missed plotting your "datum" 0.5^2
Just made that work sheet quick. True, X_Y plot is big cannon
for the 1rst contour and Waterloo for the 2nd contour.
Some tips added, not refined [just from foundry].
Cheers, Jean
Contour X_Y plot.sm (37,73 KiB) descargado 1606 vez(es).
Just made that work sheet quick. True, X_Y plot is big cannon
for the 1rst contour and Waterloo for the 2nd contour.
Some tips added, not refined [just from foundry].
Cheers, Jean
Contour X_Y plot.sm (37,73 KiB) descargado 1606 vez(es).
Russia ☭ forever, Viacheslav N. Mezentsev
WroteHuman eye example (you lost β).
____________________
Thanks Uni,
Beta got lost in the transit ... Beta is 2 in my work sheet
Jean
Something crooked happend in this forum.
A minute ago there was a big display about "plotG",
now gone. From recollection it's about plotting points.
"plotG" is obsolete: to cumbersome, too slow.
"plotG" is OK for few points
Jean
Utilities Plot Points.sm (18,5 KiB) descargado 1599 vez(es).
A minute ago there was a big display about "plotG",
now gone. From recollection it's about plotting points.
"plotG" is obsolete: to cumbersome, too slow.
"plotG" is OK for few points
Jean
Utilities Plot Points.sm (18,5 KiB) descargado 1599 vez(es).
A 1 usuarios les gustó este mensaje
Davide Carpi 20/1/2016 9:06:00
WroteWroteCitarOpen issues:
- handling of undefined values
Updated. Try again.
Thanks for the update. Plotting ln(x) now works. Still I keep annoying. Division by zero causes trouble. I frequently use this as a handy trick to limit curves to certain ranges.
i tried and not sure how how to plot ln(x) as previously shown. is there a way to do it still by just typing in ln(x)?
Division by zero causes trouble.
I tried and not sure how how to plot ln(x) as previously shown.
Is there a way to do it still by just typing in ln(x)
____________________________________________
There are several things in there to know.
Smath is granular, very granular. It means that between two
numerical values, it won't distinguish which one is true because
Smath is a 32 bits system. It is not a full extended 64 floating
point. Smath will calculate ln(10^-99) and will issue error
message "ln(0) is not defined" for ln(10^-100)
Mathcad/Mathsoft calculates ln(10^-307) no sweat. Mathcad/Mathsoft
is much less granular [extended floating point 64]
Convention is that ln(0) is defined complex to enable issuing an
error message for most unguarded systems.
X_Y plot is superb for plotting most difficult contour f(x,y)
but for other math stuff, X_Y plot is [just read me: piece of crap].
Plot ln(x+epsilon) .... espilon:= 10^-99
As well plot ln(|x|) .... |x| absolute.
Division by zero is just one or more than one coinciding occurence(s).
You will have that in any system. Just make the project not to divide by 0
Jean
I tried and not sure how how to plot ln(x) as previously shown.
Is there a way to do it still by just typing in ln(x)
____________________________________________
There are several things in there to know.
Smath is granular, very granular. It means that between two
numerical values, it won't distinguish which one is true because
Smath is a 32 bits system. It is not a full extended 64 floating
point. Smath will calculate ln(10^-99) and will issue error
message "ln(0) is not defined" for ln(10^-100)
Mathcad/Mathsoft calculates ln(10^-307) no sweat. Mathcad/Mathsoft
is much less granular [extended floating point 64]
Convention is that ln(0) is defined complex to enable issuing an
error message for most unguarded systems.
X_Y plot is superb for plotting most difficult contour f(x,y)
but for other math stuff, X_Y plot is [just read me: piece of crap].
Plot ln(x+epsilon) .... espilon:= 10^-99
As well plot ln(|x|) .... |x| absolute.
Division by zero is just one or more than one coinciding occurence(s).
You will have that in any system. Just make the project not to divide by 0
Jean
First, let me say a big "thank you" for this X-Y Plot. It has been very helpful for me. I found your example file with worksheet controls for some of the parameters like X & Y limits. That was exactly what I needed as I wanted to scale a graph to have extents 10% greater than the worksheet values being graphed. But is there a list of all of the parameters that can be controlled through the worksheet? Since you are using XYPlot as the variable name and the parameter as the subscript, what would you use for parameters like the names of each data series? Or are there even worksheet controls set up yet for those parameters? I do keep having an issue with the names of the 4 data series in my graph disappearing, and the legend description then being blank, so I think tying those to a worksheet definition would be beneficial. Thank you again for all the hard work!
Jason
Jason
Jason McCool
Robbins Engineering
Little Rock, AR, USA
Hello, Jason:
The Maxima X_Y plot and the Smath Quickplot [@] are two different animals.
On simple projects, either one will do. Ofen you need both for same project.
The X_Y plot is gorgeous to plot implicit f(x,y) as it plots the 0 level contour,
the 0 level contour interpreted as f(x,y)=0. I just noticed that it may be
wrong. The X_Y plot in work sheet "Wolfram looping" is wrong. I have two
proofs of this assertion: Mathcad 11 & Smath Quickplot.
On the other hand, the X_Y plot for "Doublet" is quite correct.
The X_Y "Wolfram Looping" seems to upset X_Y because of so many complex
sub-plot components [my guess], X_Y gets lost or interprets unknown.
Plotting is quite a skill to acquire, no matter the tool.
Jean
2D Plot ln(x).sm (8,31 KiB) descargado 1549 vez(es).
Contour Advisor [Wolfram Looping].sm (120,51 KiB) descargado 1366 vez(es).
Both work sheets are: Smath 5346 OFFicial release.
The Maxima X_Y plot and the Smath Quickplot [@] are two different animals.
On simple projects, either one will do. Ofen you need both for same project.
The X_Y plot is gorgeous to plot implicit f(x,y) as it plots the 0 level contour,
the 0 level contour interpreted as f(x,y)=0. I just noticed that it may be
wrong. The X_Y plot in work sheet "Wolfram looping" is wrong. I have two
proofs of this assertion: Mathcad 11 & Smath Quickplot.
On the other hand, the X_Y plot for "Doublet" is quite correct.
The X_Y "Wolfram Looping" seems to upset X_Y because of so many complex
sub-plot components [my guess], X_Y gets lost or interprets unknown.
Plotting is quite a skill to acquire, no matter the tool.
Jean
2D Plot ln(x).sm (8,31 KiB) descargado 1549 vez(es).
Contour Advisor [Wolfram Looping].sm (120,51 KiB) descargado 1366 vez(es).
Both work sheets are: Smath 5346 OFFicial release.
4.sm (47,59 KiB) descargado 1555 vez(es).The parameterization of implicit functions by Draghilev method
1."Quiz function", 2."Human eye"
Schedule parameterized function coincides with the graph of X-Y Plot Region (dot).


1."Quiz function", 2."Human eye"
Schedule parameterized function coincides with the graph of X-Y Plot Region (dot).
A 2 usuarios les gustó este mensaje
Note sure if this is an X-Y plot bug, but I'll refer to this users post: http://en.smath.info/forum/yaf_postst7977findunread_Smath-Page-Freezing.aspx
Essentially trying to plot a function with an undefined variable caused the screen to freeze.
Essentially trying to plot a function with an undefined variable caused the screen to freeze.
Feel free to join the SMath Studio Users Discord Channel: https://discord.gg/PayZpJW
Hello all,
I tried to follow this discussion, but I'm not convinced I've found the answer to this: what syntax is required to change the value of Chart2DLib.LineStyle of an X-Y Plot from the Math region?
I managed to change the XYPlot.XLimMin etc. follwing the example in the reference book, but I could do with my line styles not being reset everytime I get some duff values to the plot region.
Also: I'd like to place some labels and symbol in my plot to make it look more like a CAD drawing. Is there a way to draw them as is possible with the built-in 2D plot region?
All help is welcome.
Regards,
Marco
I tried to follow this discussion, but I'm not convinced I've found the answer to this: what syntax is required to change the value of Chart2DLib.LineStyle of an X-Y Plot from the Math region?
I managed to change the XYPlot.XLimMin etc. follwing the example in the reference book, but I could do with my line styles not being reset everytime I get some duff values to the plot region.
Also: I'd like to place some labels and symbol in my plot to make it look more like a CAD drawing. Is there a way to draw them as is possible with the built-in 2D plot region?
All help is welcome.
Regards,
Marco
1. You can place legend in any of the 4 corners.
2. On the main menu: click
2. On the main menu: click
- to access the plot specifications.
3. plot ln(x) is OK because computable by default.
4. plot x^(0.5-1)*exp(-x) will freeze/crash the X_Y page, no rescue
for that page. Close computer might rescue the other pages that were
working before the crash.
Search this forum containing "Isometric" [this spring]
Jean
http://en.smath.info/forum/yaf_postst8138_Maxwell-Orthogonal-on-Isometric.aspx
Tried with Smath 0.98.6604. Observed the bug both at W10-x64 and W7-x86. Don't know if previous versions behave the same.
While the Plot can comprehend the evaluation inside sys(), X-Y Plot needs an additional line() to be used.
However, when two matrix is augmented inside the graphic first matrix is being used twice.
Duplication doesn't seems to happen with the stack.
Regards
X-Y Plot.sm (18,01 KiB) descargado 1555 vez(es).
While the Plot can comprehend the evaluation inside sys(), X-Y Plot needs an additional line() to be used.
However, when two matrix is augmented inside the graphic first matrix is being used twice.
Duplication doesn't seems to happen with the stack.
Regards
X-Y Plot.sm (18,01 KiB) descargado 1555 vez(es).
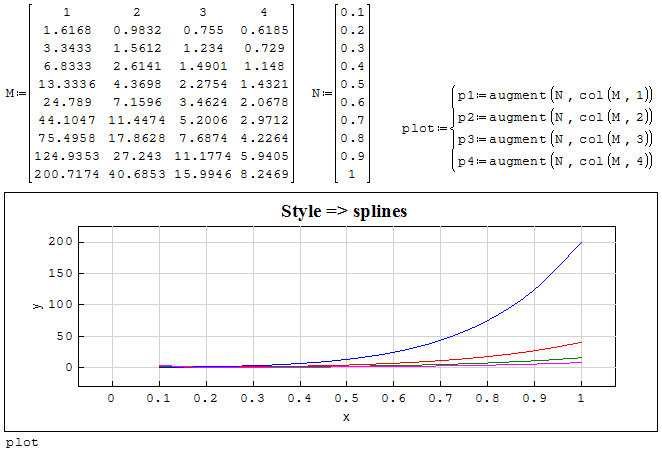
Yeah Jean, I know it can be plotted that way or another.
But I have my own reasons to do the augmentation inside
the plot and recursive "M:=(augment(N;M)" method.
While I can do it with built-in plot, I can't do it with
X-Y Plot Plugin. And if you do it like "MM:=(augment(N;M)"
it can be plot correctly because augment command is generating
correct matrix. The problem is here is not the plotting,
augment is giving wrong result. This is why I considered
this as a bug.
Regards
But I have my own reasons to do the augmentation inside
the plot and recursive "M:=(augment(N;M)" method.
While I can do it with built-in plot, I can't do it with
X-Y Plot Plugin. And if you do it like "MM:=(augment(N;M)"
it can be plot correctly because augment command is generating
correct matrix. The problem is here is not the plotting,
augment is giving wrong result. This is why I considered
this as a bug.
Regards
A 1 usuarios les gustó este mensaje
frapuano 2/2/2018 6:12:00
- Nuevos mensajes
- Sin mensajes nuevos