1 страниц (4 вхождений)
Plots improvements - Сообщения
#1 Опубликовано: 16.04.2013 15:04:32

Hi all,
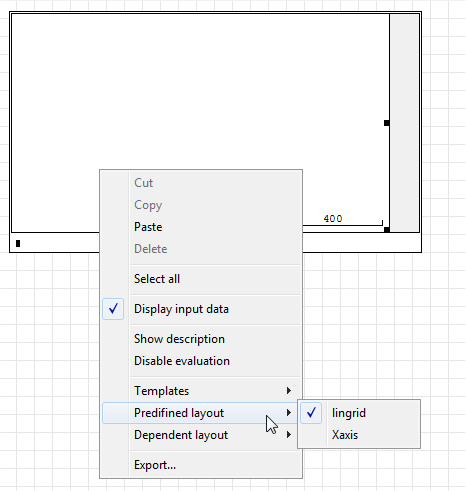
Looking in the SVN repository, I've seen an interesting unrelased/undocumented/(unfinished?) plugin made by Andrey: ConstructorRegion. This plugin create an object to work whit dxf files (see the screenshot).
Although I have not yet entirely understand how it works (both the code and the front-end object) I was literally kidnapped by the potential of this plugin; I think that starting from this plugin a good programmer could create a parallel graphics plugin that implements the missing features of current 2D graphs (I think about the decimal and logarithmic grids, plot limits, histograms, pie charts and others...).
No one feels to try?
best regards,
w3b5urf3r
If you like my plugins please consider to support the program buying a license; for personal contributions to me: paypal.me/dcprojects
#2 Опубликовано: 18.04.2013 11:39:20
whats the potential for this plugin to create files for autocad? It'd be nice to be able to export the drawings from smath into files that autocad can read.
#3 Опубликовано: 19.04.2013 10:28:24
A bit off-topic ^^ but let me mention three graphing controls whose licenses seem compatible to develop plugins for Smath.
Microsoft Chart Controls for Microsoft .NET Framework 3.5
It allow scientific graphing apart from the samples shown [url=Samples Environment for Microsoft Chart Controls]here[/url]. I'm not sure about its license though, something about restricting their use in other platforms different from windows.
ZedGraph
Only for 2d. A couple links explaining their use:
http://www.codeproject.com/Articles/5431/A-flexible-charting-library-for-NET
http://quantcsharp.webs.com/howtousezedgraph.htm
Asymptote
http://asymptote.sourceforge.net/
#4 Опубликовано: 31.12.2015 00:34:08
Interesting: YES
That's reminds me 15 years working 3 Mathcad versions: 8 Pro, 2001i, 11.
My dead Mathcad 11 is quite big > 1800 WS ! I would say ~ 5 XY graphs per WS ... [multiply]
+++ at least twice that number during oonstruction.
Hundred of Mathsoft Collabs wanted the "Moon about XY plot" .
I gave many "Moons" ... "Moon at their taste" was quite a challenge !
The "Moon" had to be: biger, smaller, flat, square, ellipsoid, painted, pixel adjustable ... etc.
In fact, Mathcad was very generous and for what it is capable: the best publishing quality.
I used to love XY graphs from OriginLab [very largely used in Medical/Pharmaco stuff].
Freeware "Scilab" is very interesting too. Could Andrey get the free code ?
Jean ... cheers best to all Smath users 2016.
1 пользователям понравился этот пост
ioan92 31.12.2015 05:59:00
1 страниц (4 вхождений)
-
 Новые сообщения
-
 Нет новых сообщений