1 страниц (3 вхождений)
ploting function that has the summation sign in it. - ploting function that has the summation sign in it. - Сообщения
#1 Опубликовано: 11.08.2023 15:47:51
Hi guys,
I'm trying to plot a function that has the sigma operator in it.
I'm unable to do it with Smath.
I made a worksheet to demonstrate this issue.
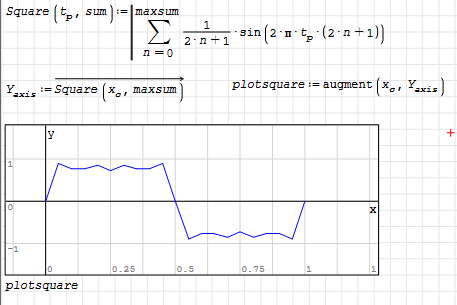
It is a simple example that plots a square wave as function of the harmonics added to a sinusoidal wave.
First part is to show I plot a sinus function, which works just fine.
However when I try the square wave function with the summation operator in the function I does not work that way.
What I'm I doing wrong?
See attachment.square_wave.sm (9 КиБ) скачан 56 раз(а).
Please help.
Best regards Sonya
I'm trying to plot a function that has the sigma operator in it.
I'm unable to do it with Smath.
I made a worksheet to demonstrate this issue.
It is a simple example that plots a square wave as function of the harmonics added to a sinusoidal wave.
First part is to show I plot a sinus function, which works just fine.
However when I try the square wave function with the summation operator in the function I does not work that way.
What I'm I doing wrong?
See attachment.square_wave.sm (9 КиБ) скачан 56 раз(а).
Please help.
Best regards Sonya
#2 Опубликовано: 11.08.2023 16:26:31
Hi. You are not doing nothing wrong, just SMath sometimes requires for some functions the line() instruction as a wrapper for delay de evaluations. And I don't know a general rule for that.
square_wave.sm (7 КиБ) скачан 73 раз(а).
Best regards.
Alvaro.
square_wave.sm (7 КиБ) скачан 73 раз(а).
Best regards.
Alvaro.
1 пользователям понравился этот пост
sergio 12.08.2023 08:02:00
#3 Опубликовано: 12.08.2023 10:18:38
WroteWhat I'm I doing wrong ?
Indirectly, the argument of Sum is over the vector xc.
If you vectorize that argument, no need local definition
Mesh finer xc for higher maximum.
By same token, your system is ordinary Fourier.
You may want experiment Fourier/Fejer/Lanczos.
Please, confirm it works.
Cheers ... Jean.
Fourier Fejer Lanczos.sm (11 КиБ) скачан 66 раз(а).
1 страниц (3 вхождений)
-
 Новые сообщения
-
 Нет новых сообщений