1 Pages (11 items)
Bode Plot - Messages
#1 Posted: 11/18/2009 8:26:30 AM
Hi to everyone,
I am using Smath for calculation of stability for switching mode power supply.
Now i tried to plot a transfer function F(S) with poles and zeros but the 2D graphic cannot allow to have an logarithmic X axis.
Have you planned to add this functionality or is it possible to substitute the x array with a logarithmic ones?
Regards
Giuliano
#2 Posted: 11/18/2009 10:06:56 AM

Hello, Giuliano.
Here is some workaround:
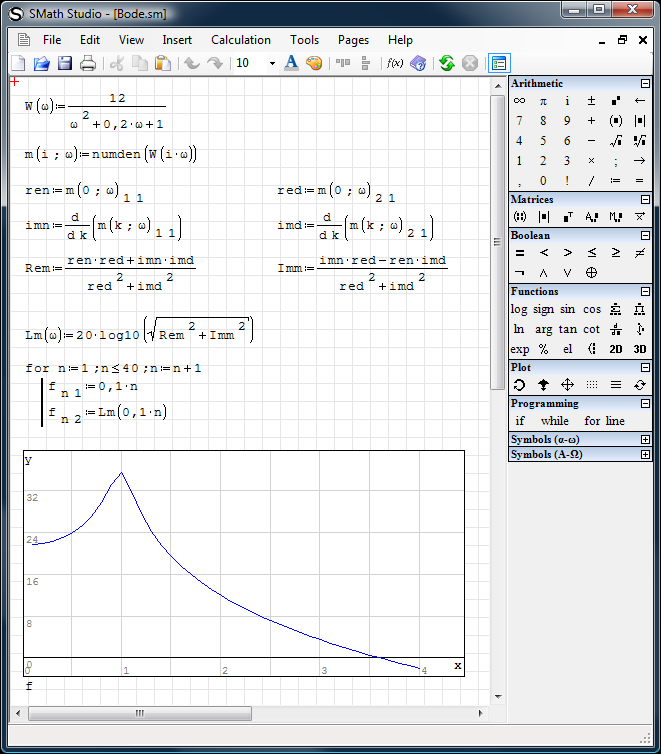
Bode.sm
Yes, but it is not urgent task, so I can't say how much time it will take.
Best regards, Andrey Ivashov.
Here is some workaround:
Bode.sm
WroteHave you planned to add this functionality or is it possible to substitute the x array with a logarithmic ones?
Yes, but it is not urgent task, so I can't say how much time it will take.
Best regards, Andrey Ivashov.
#3 Posted: 11/18/2009 11:49:57 AM
Thank you very much. It will be very helpful.
Great job, Smath is a surprise.
Bye
Giuliano
Great job, Smath is a surprise.
Bye
Giuliano
#4 Posted: 11/18/2009 12:11:36 PM
A suggestion: is it possible to have a archive of all the available workaround?
I understand that it is in your mind to add everything but for the moment could be interesting to know how to do what it is not implemented yet.
bye
Giuliano
I understand that it is in your mind to add everything but for the moment could be interesting to know how to do what it is not implemented yet.
bye
Giuliano
#5 Posted: 11/18/2009 12:19:08 PM
Giuliano, of course you are right. I suggest you to check our Wiki - omorr and Greg Locock have made a great job and mentioned many interesting things there.
#6 Posted: 11/18/2009 12:20:48 PM

Hello Giuliano
Take a look at the wiki, please. You are welcome to put any workarounds, examples etc. there, as anyone else. If you solved your problem using this help, share with us. This way we could have lots of things in one place. I can even do it for you, if you like.
Regards,
Radovan
WroteA suggestion: is it possible to have a archive of all the available workaround?
I understand that it is in your mind to add everything but for the moment could be interesting to know how to do what it is not implemented yet.
bye
Giuliano
Take a look at the wiki, please. You are welcome to put any workarounds, examples etc. there, as anyone else. If you solved your problem using this help, share with us. This way we could have lots of things in one place. I can even do it for you, if you like.
Regards,
Radovan
When Sisyphus climbed to the top of a hill, they said: "Wrong boulder!"
#7 Posted: 11/19/2009 7:03:01 AM
Probably a bit early to get picky, but a real Bode plot has log frequency on the x axis, and log magnitude or dB on the Y axis, and immediately above that a second graph pane showing phase, wrapped at either +/-180 or 0-360 degrees.
However I see that electronics people put the phase UNDER the magnitude plot.
However I see that electronics people put the phase UNDER the magnitude plot.
#8 Posted: 11/19/2009 8:11:58 AM
WroteProbably a bit early to get picky, but a real Bode plot has log frequency on the x axis, and log magnitude or dB on the Y axis, and immediately above that a second graph pane showing phase, wrapped at either +/-180 or 0-360 degrees.
However I see that electronics people put the phase UNDER the magnitude plot.
You are right. This is what I want.
Now I am trying to understand what wrote Andrey, it is a bit difficult for me (this is why I have not answer yet).
What I thought to do, is to create an array with a fixed number of points for a decade.
Use this array to calculate the transfer function instead of using x.
At the end, I plot in 2D graphic these points with logarithmic axis.
In Mathcad is something like what you find in this link
Mathcad Transfer Function
#9 Posted: 4/21/2010 4:34:51 PM
How did you do that conditional entry? If I type this:
for(k:1,k
at this point it changes the layout and I can't enter "k:k+1". I downloaded the file you kindly provided, copy-pasted , changed the variables, functions and tried it but...

I have some functions which have k=1...N/2 and I need them displayed for each of the values of k. I don't mind if they're matrix-like, I just need them displayed for any value of N previously entered.
...help?
for(k:1,k
at this point it changes the layout and I can't enter "k:k+1". I downloaded the file you kindly provided, copy-pasted
, changed the variables, functions and tried it but... I have some functions which have k=1...N/2 and I need them displayed for each of the values of k. I don't mind if they're matrix-like, I just need them displayed for any value of N previously entered.
...help?
#10 Posted: 4/21/2010 5:31:36 PM
See wiki to understand how For loop with 4 arguments could be inserted: https://smath.com/wiki/for.ashx
Btw, you can simply choose for loop with 4 arguments from the Dynamic Assistance items list:

Regarding your screenshot: after passing the For loop on the top variable "k" gets a value about N/2+1 or similar. This is a number. You have no value into the vectors with such index. See pic for details:

Btw, you can simply choose for loop with 4 arguments from the Dynamic Assistance items list:
Regarding your screenshot: after passing the For loop on the top variable "k" gets a value about N/2+1 or similar. This is a number. You have no value into the vectors with such index. See pic for details:
1 Pages (11 items)
-
 New Posts
-
 No New Posts