X-Y Plot Region - Extends SMath Studio with a X-Y Plot Region. - Messages
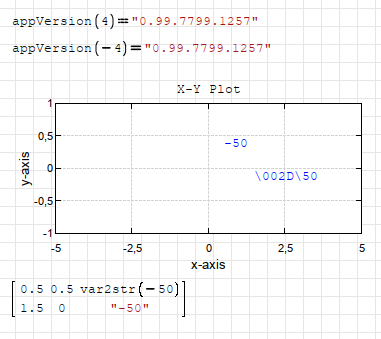
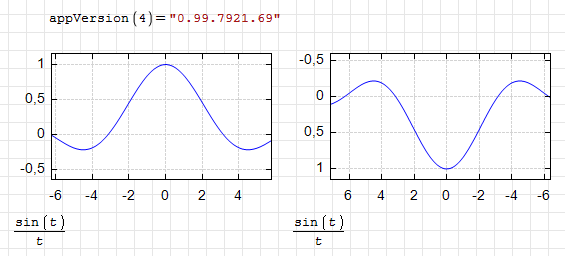
WroteIn latest SS 99.7799, I experience a label error similar to image as shown.
Some previous files show this error.
I couldn't replicate this bug but if you have it then there it is.
Maybe I don't have old files that particular versions which gives this bug.
But I can tell there is another one.

WroteOriginally Posted by: ndtma [url=/forum/yaf_postsm70673_X-Y-Plot-Region.aspx#post70673][/url]In latest SS 99.7799, I experience a label error similar to image as shown.
Some previous files show this error.
I couldn't replicate this bug but if you have it then there it is.
Maybe I don't have old files that particular versions which gives this bug.
But I can tell there is another one.
Hello.
Thanks for the feedback. I also had this problem.
Therefore, I downloaded and checked the file of Alyles and observed the error as shown in my last post.
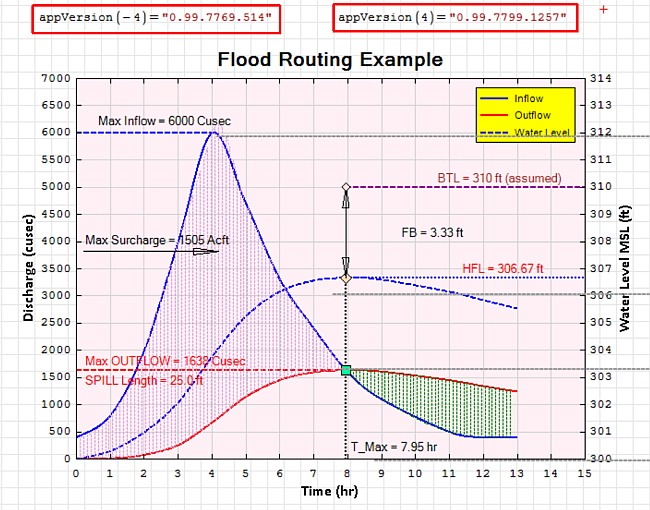
Consequent to your post, I checked my collection and observed a strange situation
with a one saved in version 99.7769 where no such error occurred when opened with 99.7799.
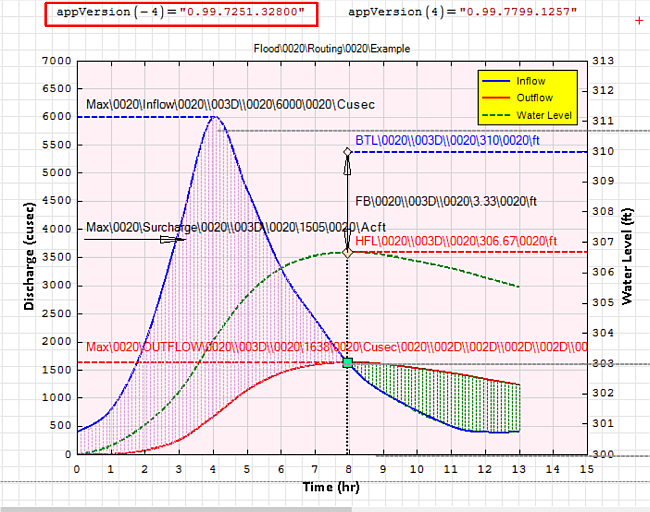
On the other hand, a similar file in 99.7251 showed the error as shown.
Look within!... The secret is inside you.
Best Regards
Eng. NDTM Amarasekera - Sri Lanka

These numbers encode the text. Andrey changed something in new versions and I need to make changes in the plugin. Hopefully this only affects the display of the data.
Russia ☭ forever, Viacheslav N. Mezentsev
1 users liked this post
NDTM Amarasekera 2021/5/11 06:59:00

WroteThese numbers encode the text. Andrey changed something in new versions and I need to make changes in the plugin. Hopefully this only affects the display of the data.
You're right, Viacheslav.
You need to use this line of code to decode text entries:
QuoteTermsConverter.DecodeText(txt)
As I already mentioned, we have such kind of issues for a long time already. But in one of the latest beta versions I've made encoding more strict, so issues appears much more often now. Let's say that it is our chance to catch them and fix.
Best regards.
2 users liked this post
Plugin updated. Please try.
Changes:
- plug-in corrected to respect latest SMath Studio API changes.
Russia ☭ forever, Viacheslav N. Mezentsev
2 users liked this post
Thanks. It works now.
Look within!... The secret is inside you.
Best Regards
Eng. NDTM Amarasekera - Sri Lanka
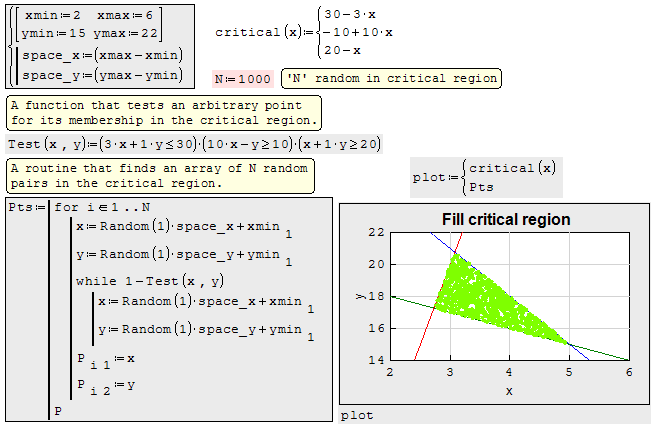
Small piece of code for filled 2-D contour plot in the XY plot plugin.
FillContour.sm (34.45 KiB) downloaded 1496 time(s).
FillContour.pdf (306.44 KiB) downloaded 1045 time(s).
Best regards
Alvaro.
FillContour.sm (34.45 KiB) downloaded 1496 time(s).
FillContour.pdf (306.44 KiB) downloaded 1045 time(s).
Best regards
Alvaro.
2 users liked this post
Added contour levels over the filled 2-D contour plot.
ContourLevels.sm (87.15 KiB) downloaded 867 time(s).
ContourLevels.pdf (1.2 MiB) downloaded 476 time(s).
Best regards
Alvaro.
ContourLevels.sm (87.15 KiB) downloaded 867 time(s).
ContourLevels.pdf (1.2 MiB) downloaded 476 time(s).
Best regards
Alvaro.
4 users liked this post
IVR 2021/6/12 14:02:00, Fridel Selitsky 2021/5/26 17:17:00, sergio 2021/5/26 15:27:00, Вячеслав Мезенцев 2021/5/26 14:17:00
Slightly modified for accept loops and conditionals in the function procedure for functions like Mandelbrot set.
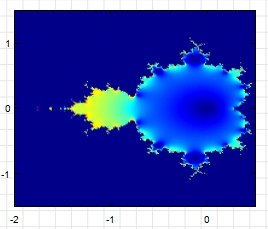
MandelbrotSet.sm (60.78 KiB) downloaded 863 time(s).
MandelbrotSet.pdf (772.06 KiB) downloaded 457 time(s).
Best regards
Alvaro.
MandelbrotSet.sm (60.78 KiB) downloaded 863 time(s).
MandelbrotSet.pdf (772.06 KiB) downloaded 457 time(s).
Best regards
Alvaro.
3 users liked this post
Вячеслав Мезенцев 2021/6/11 22:11:00, João Felipe Seráfico Melo 2021/6/11 08:04:00, Fridel Selitsky 2021/6/11 10:09:00
Plugin updated. Please try.
Changes:
- fixed an issue with incorrect drawing of grid lines when changing the direction of the axis.
Russia ☭ forever, Viacheslav N. Mezentsev
1 users liked this post
sergio 2021/10/25 11:46:00
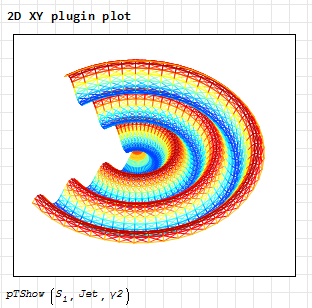
A colormaped trimesh in the XY plugin.
pShowTMesh.sm (53.22 KiB) downloaded 857 time(s).
Best regards.
Alvaro.
pShowTMesh.sm (53.22 KiB) downloaded 857 time(s).
Best regards.
Alvaro.
3 users liked this post
Plugin updated.
Changes:
- fixed problem when copying a region (some properties of the chart style were not copied).
Russia ☭ forever, Viacheslav N. Mezentsev
2 users liked this post
Linear polar examples.
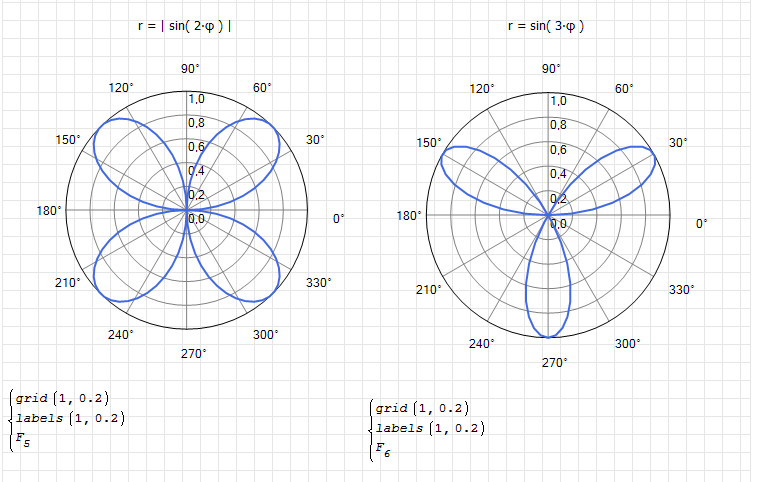
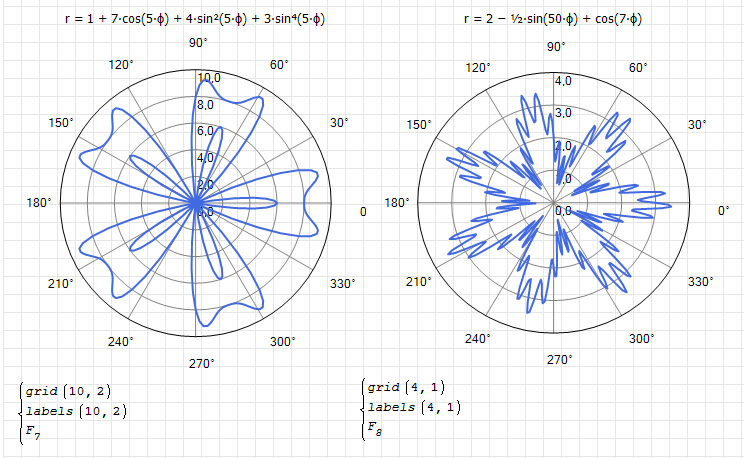
XYPlot. Linear polar.sm (56.78 KiB) downloaded 1551 time(s).
XYPlot. Linear polar.pdf (134.78 KiB) downloaded 919 time(s).
XYPlot. Linear polar.sm (56.78 KiB) downloaded 1551 time(s).
XYPlot. Linear polar.pdf (134.78 KiB) downloaded 919 time(s).
Russia ☭ forever, Viacheslav N. Mezentsev
5 users liked this post
overlord 2021/11/16 20:27:00, Davide Carpi 2021/11/17 08:31:00, sergio 2021/11/16 17:39:00, Alvaro 2021/11/16 17:09:00, João Felipe Seráfico Melo 2021/11/16 17:02:00
WroteLinear polar examples.
Hi. Very nice and useful plots. In some cases you can get more or less the same result with less effort using the plugin's ability to graph implicit functions.
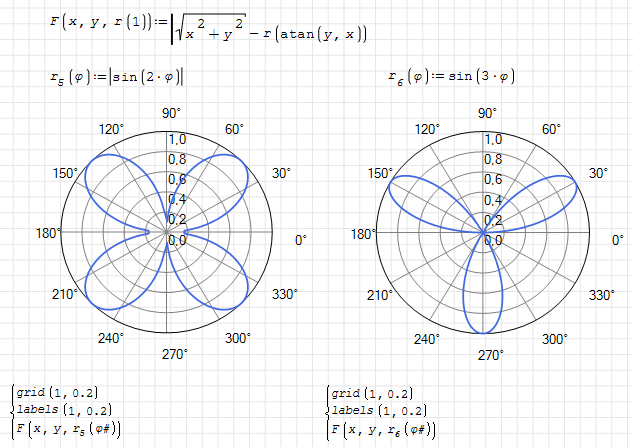
Best regards.
Alvaro.
5 users liked this post
NDTM Amarasekera 2021/11/17 03:13:00, sergio 2021/11/17 08:25:00, overlord 2021/11/16 21:53:00, Davide Carpi 2021/11/17 08:31:00, Вячеслав Мезенцев 2021/11/17 03:27:00
Plugin updated.
Changes:
- restored the ability to use units in arguments.
Russia ☭ forever, Viacheslav N. Mezentsev
3 users liked this post
sergio 2021/11/18 11:33:00, João Felipe Seráfico Melo 2021/11/18 11:01:00, NDTM Amarasekera 2021/11/18 12:45:00
Plugin updated. It works, but the component is still not stable.
Changes:
- added support for parametric plot type.
'~' is used as a mark for the "range" variable and should only be used inside the X-Y Plot. When used in conjunction with ODE solvers (with a lspline() function), too many calculations are obtained and it is impossible to use this method.
Russia ☭ forever, Viacheslav N. Mezentsev
Plugin updated.
Changes:
- some broken functionality repaired;
- fixed error in determining the field width for vertical axes;
- the decimal symbol is taken from the program settings now;
- the midpoint is replaced by the multiplication sign ×;
- added the ability to change the scales of the axes using the mouse wheel;
- refactored.
File not found. File not found.
Russia ☭ forever, Viacheslav N. Mezentsev
1 users liked this post
sergio 2021/12/15 06:53:00
Plugin updated.
Changes:
- fixed a critical error when copying a region;
- rendering of linetypes (dash, ...) slightly changed (enlarged);
- added support for automatic drawing of the region when the document autocalculation mode is enabled (for now only for zoom mouse event).
Russia ☭ forever, Viacheslav N. Mezentsev
2 users liked this post
Plugin updated.
Changes:
- returned red border on error;
- more complete support for auto-recalculation mode.
Russia ☭ forever, Viacheslav N. Mezentsev
3 users liked this post
Martin_B 2021/12/18 17:28:00, João Felipe Seráfico Melo 2021/12/17 09:21:00, sergio 2021/12/17 11:03:00
- New Posts
- No New Posts