Page History: Graphs
Compare Page Revisions
Page Revision: 2012/04/28 02:08
How to add an empty graph
You can add a 2D/3D Graph from context menus:
Insert > Plot > 2D / 3D
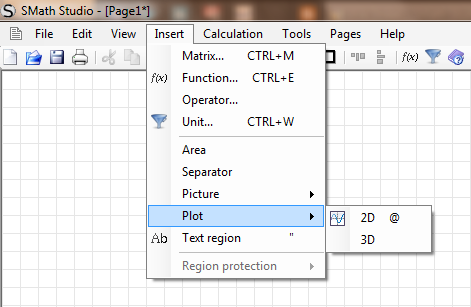
Keyboard shortcut: a 2D Graph can be added directly typing @
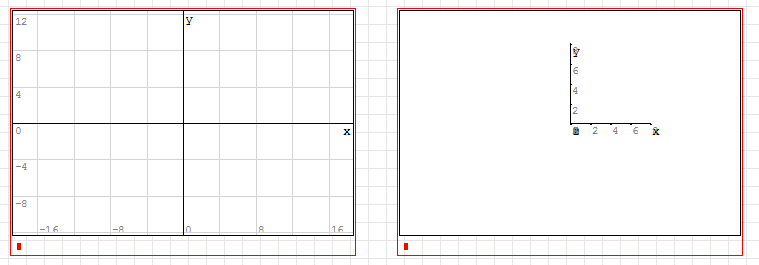
Now an empty graph will be added:
Plot equations
Variables to plot equations must be:
- 'x' and/or 'y' for 3D graphs
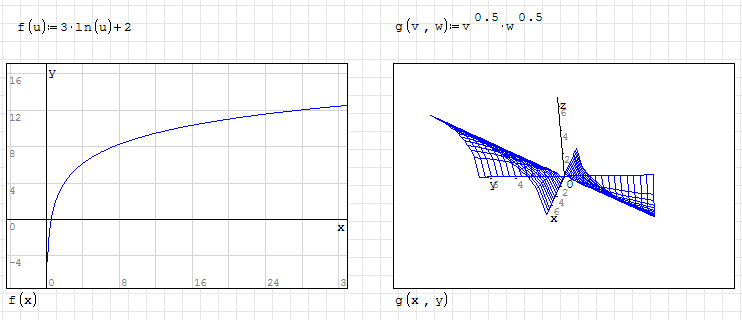
You have multiple ways to plot equations:
Directly from the plot window
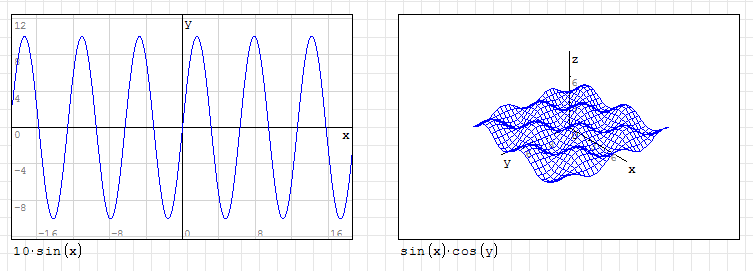
Indirectly, building your equation outside the plot window
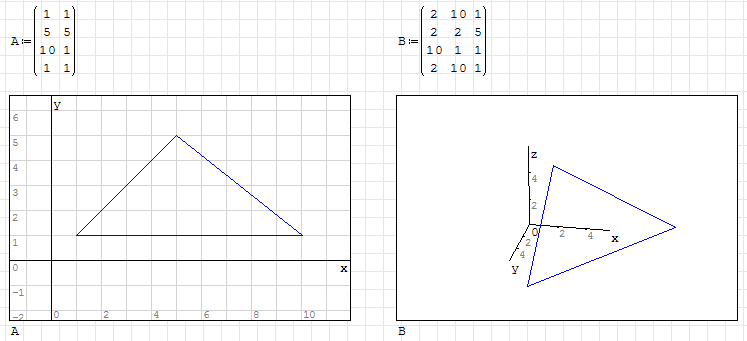
Plot matrices
You can plot figures from
matrices (directly or indirectly):
- 2 columns matrices for 2D plots
- 3 columns matrices for 3D plots
Multiple plots
You can plot multiple equations/matrices on the same graph using the
Multiple values item on the Functions
toolbox:
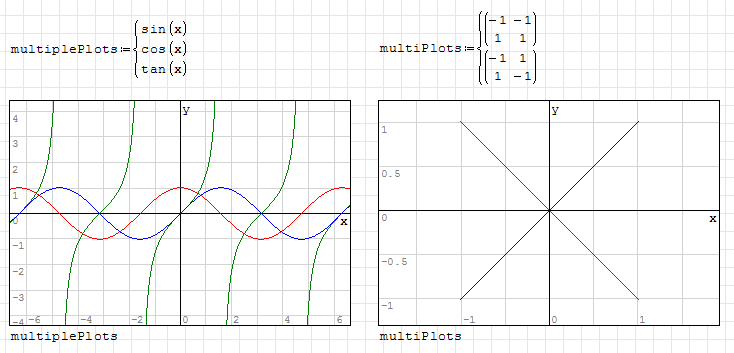
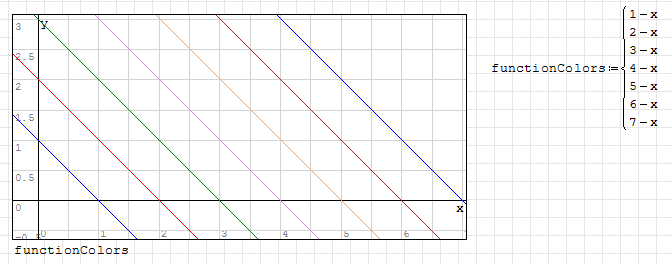
Each "value" will be colored differently (cycling between 6 colours, in the following order: blue,red,green,magenta,orange and brown)
Special plots (Words,Points,etc...)
You can plot words or characters (strings) on your graphs;
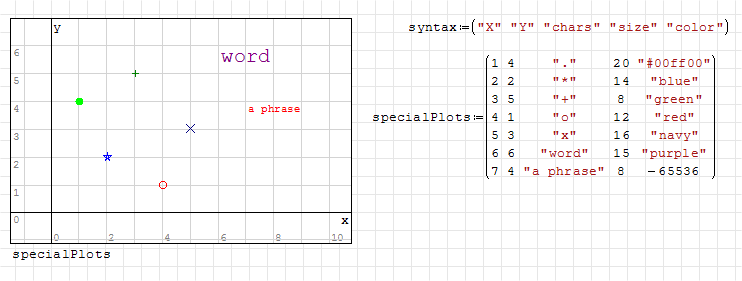
- Special characters (case sensitive) have position fixed on center on the given coordinates: + . * o x
- Many colours are allowed; here is a complete list of possible colors (spaces and upper case letters are not matter):
aliceblue, antiquewhite, aqua, aquamarine, azure,

beige, bisque, blanchedalmond, black, blue, blueviolet, brown, burlywood,

cadetblue, chartreuse, chocolate, coral, cornflowerblue, cornsilk, crimson, cyan,

darkblue, darkcyan, darkgoldenrod, darkgray, darkgreen, darkkhaki, darkmagenta, darkolivegreen, darkorange, darkorchid, darkred,
darksalmon, darkseagreen, darkslateblue, darkslategray, darkturquoise, darkviolet, deeppink, deepskyblue, dimgray, dodgerblue,

firebrick, floralwhite, forestgreen, fuchsia,

gainsboro, ghostwhite, gold, goldenrod, gray, green, greenyellow,

honeydew, hotpink,

indianred, indigo, ivory,

khaki,

lavender, lavenderblush, lawngreen, lemonchiffon, lightblue, lightcoral, lightcyan, lightgoldenrodyellow, lightgray, lightgreen,
lightpink, lightsalmon, lightseagreen, lightskyblue, lightslategray, lightsteelblue, lightyellow, lime, limegreen, linen,

magenta, maroon, mediumaquamarine, mediumblue, mediumorchid, mediumpurple, mediumseagreen, mediumslateblue, mediumspringgreen,
mediumturquoise, mediumvioletred, midnightblue, mintcream, mistyrose, moccasin,

navajowhite, navy,

oldlace, olive, olivedrab, orange, orangered, orchid,

palegoldenrod, palegreen, paleturquoise, palevioletred, papayawhip, peachpuff, peru, pink, plum, powderblue, purple,

red, rosybrown, royalblue,

saddlebrown, salmon, sandybrown, seagreen, seashell, sienna, silver, skyblue, slateblue, slategray, snow, springgreen, steelblue,

tan, teal, thistle, tomato, turquoise,

violet,

wheat, white, whitesmoke,

yellow, yellowgreen
NOTE: You can use darkblue, DarkBlue, Dark Blue (recommended), DARKBLUE, D a R k B l U e ant etc...
all spaces will be removed and color name will be converted to lower case chars.
Animated plots
See
animations
Plot handling
under constructionZooming is done with the zoom tool. If you roll your mouse wheel it zooms both axes together. If you hold 'control' at the same time it just zooms the vertical axis, and if you use 'shift' and the mouse wheel it zooms the horizontal axis.
References
under constructionTutorials and examples:
Color snippets (to help with color handling):
Related resources on wiki: