
X-Y Plot Region

X-Y Plot Region - Extends SMath Studio with a X-Y Plot Region. - Mensajes

#401 Publicado: 14/7/2020 17:57:16
Jean Giraud

Jean Giraud

983 me gusta en 6.866 mensajes.

Grupo: User

Und jetzt ?
And now => attached document to best use native X_Y plot.
#402 Publicado: 27/9/2020 16:03:48
Вячеслав Мезенцев

Вячеслав Мезенцев

1.558 me gusta en 1.868 mensajes.

Grupo: Moderator

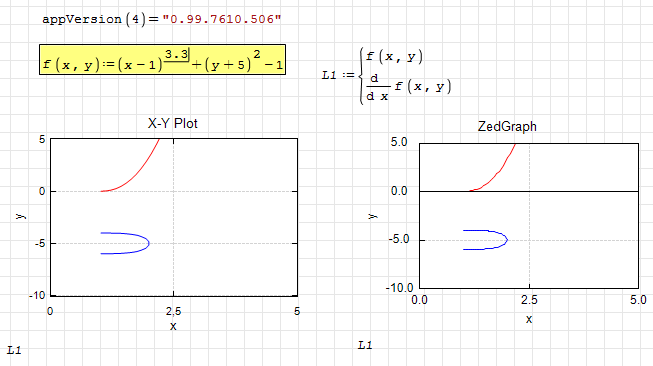
Updated.

Changes:

- the problem of drawing piecewise functions is partially solved.
Russia ☭ forever, Viacheslav N. Mezentsev
A 2 usuarios les gustó este mensaje
Martin_B 28/9/2020 8:17:00, sergio 27/9/2020 16:16:00
#403 Publicado: 21/11/2020 8:00:24
Вячеслав Мезенцев

Вячеслав Мезенцев

1.558 me gusta en 1.868 mensajes.

Grupo: Moderator

Updated.

Changes:

- SS-4652 partially fixed.

2020-11-21_16-09-08.png
Russia ☭ forever, Viacheslav N. Mezentsev
A 2 usuarios les gustó este mensaje
sergio 21/11/2020 14:03:00, Alvaro 21/11/2020 11:24:00
#404 Publicado: 11/1/2021 16:46:49
zwdt

zwdt

0 me gusta en 2 mensajes.

Grupo: User

This is a great plugin. I've been using it for several years now, and it just gets better. Thank you for it. I had a question on if there is any functionality to include a picture as the graph background?
#405 Publicado: 11/1/2021 17:38:55
Jean Giraud

Jean Giraud

983 me gusta en 6.866 mensajes.

Grupo: User

Wrote

I had a question on if there is any functionality to include a picture as the graph background?


Have you tried to slide one over the other ?
No problem for background, much less irritating .
Cheers ... Jean

#406 Publicado: 11/1/2021 18:04:22
Jean Giraud

Jean Giraud

983 me gusta en 6.866 mensajes.

Grupo: User

Wrote

Have you tried to slide one over the other ?
No problem for background, much less irritating .


Background and image was possible in Mathcad 11 but not in Smath.
Image: yes in empty region of the graph, SS 6179.
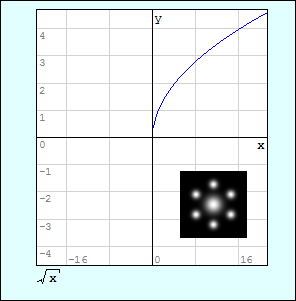
Image Background.PNG


#407 Publicado: 11/1/2021 18:55:44
zwdt

zwdt

0 me gusta en 2 mensajes.

Grupo: User

Thanks, I inserted a picture with a transparent background, and it worked out great.
#408 Publicado: 12/1/2021 11:47:23
Jean Giraud

Jean Giraud

983 me gusta en 6.866 mensajes.

Grupo: User

Wrote

Thanks, I inserted a picture with a transparent background, and it worked out great.


Can you show, very interesting.
#409 Publicado: 22/1/2021 15:56:59
Ruben Sidranski

Ruben Sidranski

17 me gusta en 465 mensajes.

Grupo: User

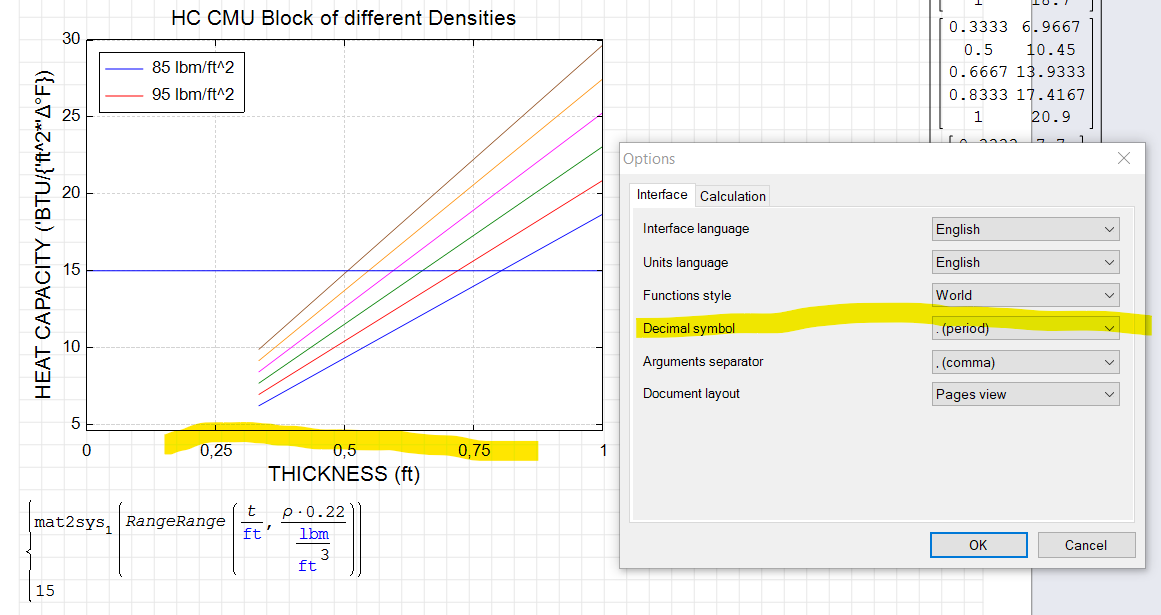
Is there a reason why the X-Y Plot is showing decimals as a comma? In the US we use periods and I cannot find where it's getting the requirement Heat Capacity Function_Sys2Mat Ber7.sm (15,07 KiB) descargado 1737 vez(es).
Screenshot 2021-01-22 134309.png
#410 Publicado: 22/1/2021 17:44:16
Jean Giraud

Jean Giraud

983 me gusta en 6.866 mensajes.

Grupo: User

Wrote

s there a reason why the X-Y Plot is showing decimals as a comma? In the US we use periods and I cannot find where it's getting the requirement


Check "Options" ... set decimal dot.
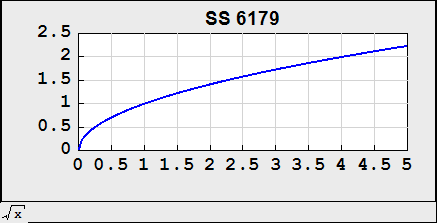
Here, we use . as decimals and never notice , decimal X_Y plot.
#411 Publicado: 23/1/2021 1:21:23
Ruben Sidranski

Ruben Sidranski

17 me gusta en 465 mensajes.

Grupo: User

Wrote

Wrote

s there a reason why the X-Y Plot is showing decimals as a comma? In the US we use periods and I cannot find where it's getting the requirement


Check "Options" ... set decimal dot.
Here, we use . as decimals and never notice , decimal X_Y plot.


Exactly. My settings are decimal dot and plot is showing comma (European style).

#412 Publicado: 23/1/2021 7:37:34
Вячеслав Мезенцев

Вячеслав Мезенцев

1.558 me gusta en 1.868 mensajes.

Grupo: Moderator

Wrote

Is there a reason why the X-Y Plot is showing decimals as a comma?


The standard 2d plot also uses a comma.

Russia ☭ forever, Viacheslav N. Mezentsev
#413 Publicado: 23/1/2021 9:28:16
Jean Giraud

Jean Giraud

983 me gusta en 6.866 mensajes.

Grupo: User

Wrote

Here, we use . as decimals and never notice , decimal X_Y plot.


Decimal.PNG
#414 Publicado: 23/1/2021 12:46:02
Ruben Sidranski

Ruben Sidranski

17 me gusta en 465 mensajes.

Grupo: User

Jean,
Where in your settings? Maybe it's the newer SMath version and older plugin. Your on 0.98 right?
#415 Publicado: 23/1/2021 13:10:21
Вячеслав Мезенцев

Вячеслав Мезенцев

1.558 me gusta en 1.868 mensajes.

Grupo: Moderator

Jean is in an alternate reality, he doesn't know what is happening at the moment.
Russia ☭ forever, Viacheslav N. Mezentsev
A 3 usuarios les gustó este mensaje
fedeghi 25/1/2021 3:54:00, ElSid 23/1/2021 18:35:00, overlord 23/1/2021 23:12:00
#416 Publicado: 25/1/2021 12:00:12
Jean Giraud

Jean Giraud

983 me gusta en 6.866 mensajes.

Grupo: User

Wrote

Exactly. My settings are decimal dot and plot is showing comma (European style).


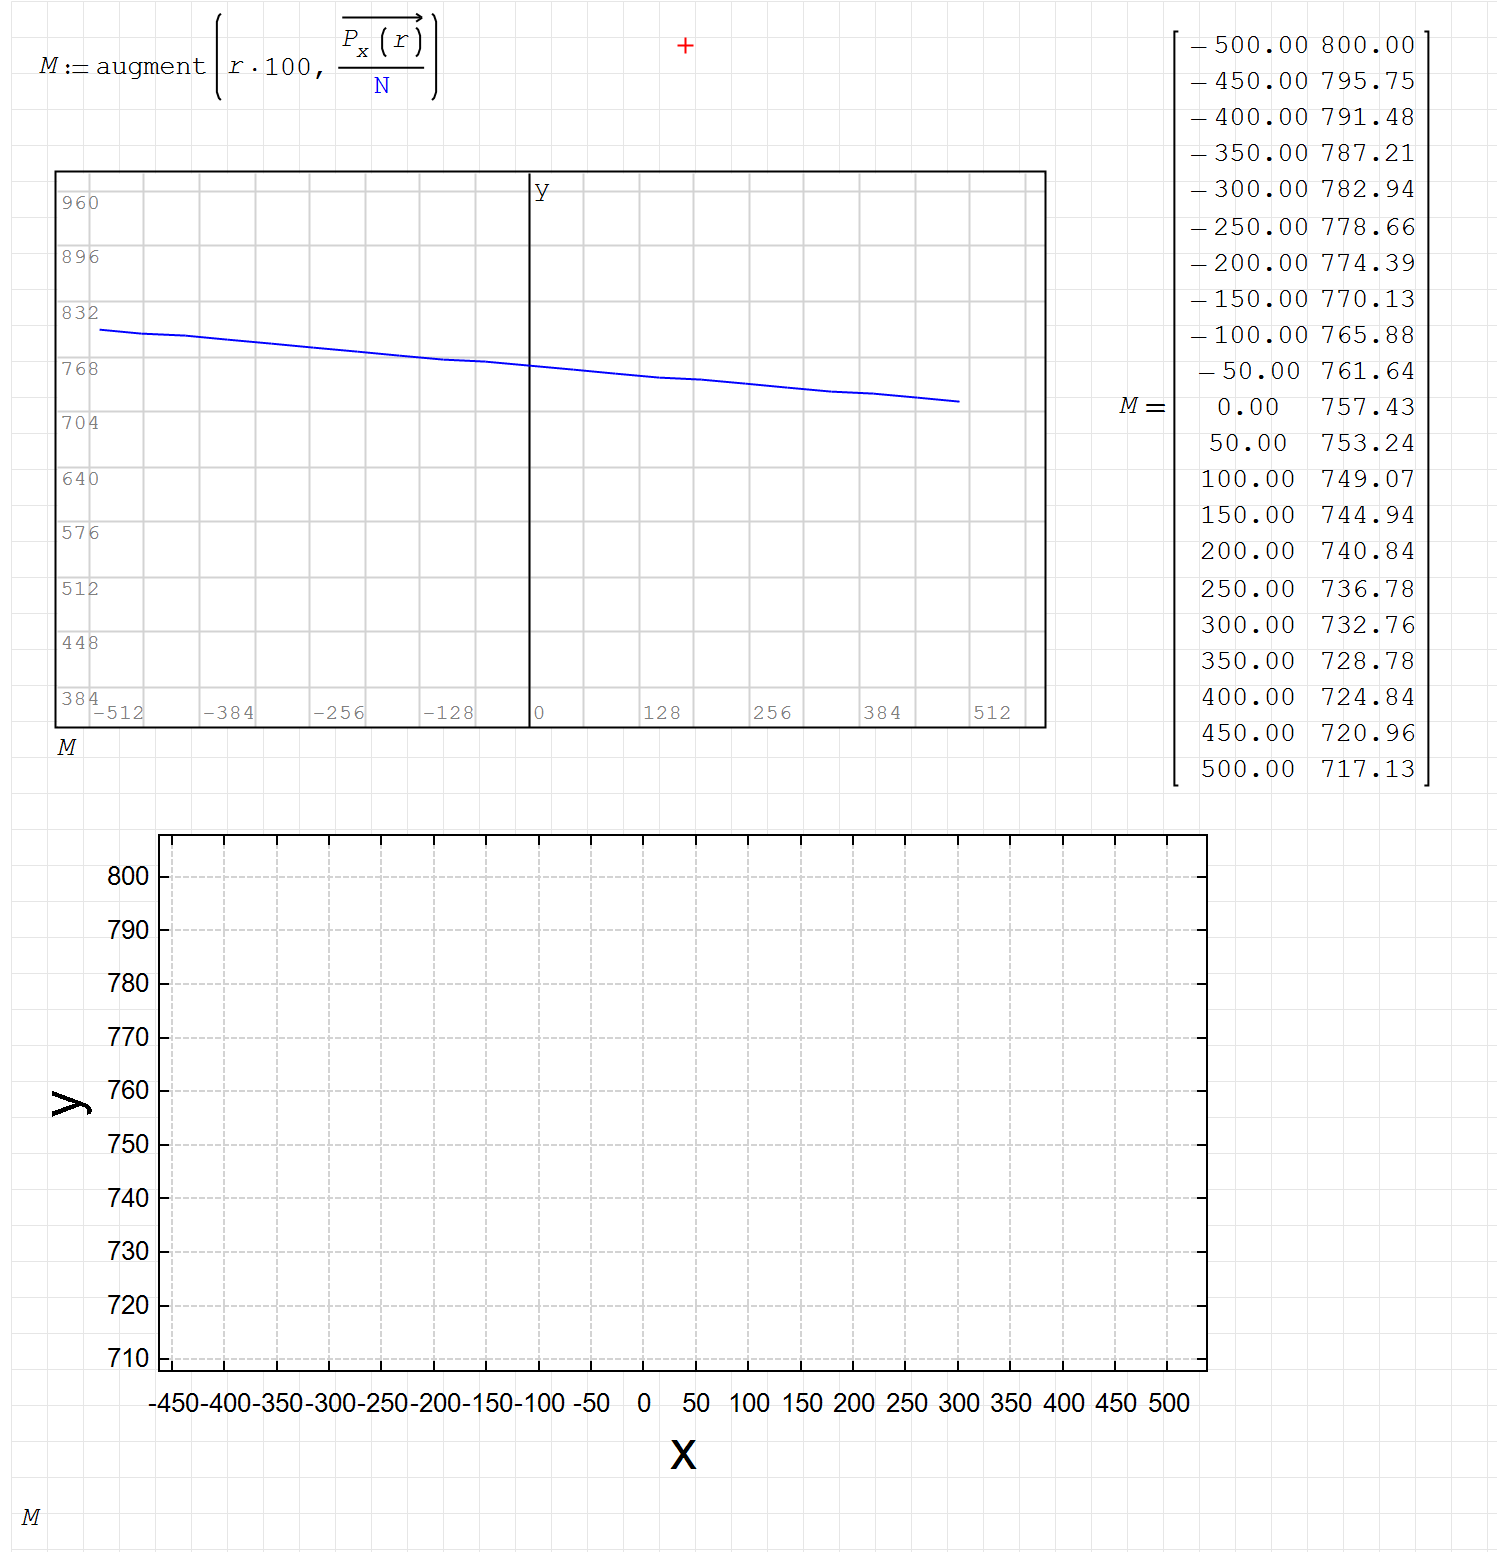
Is it, you can create a vector decimal dot and create project
with decimal dot but the alternate reality the X_Y is decimal coma ?
#417 Publicado: 30/1/2021 13:07:30
netsonicyxf

netsonicyxf

2 me gusta en 79 mensajes.

Grupo: User

Why X-Y plot can't polt this, while plot 2D can?
1.png
#418 Publicado: 30/1/2021 15:43:33
Jean Giraud

Jean Giraud

983 me gusta en 6.866 mensajes.

Grupo: User

Wrote

Why X-Y plot can't plot this, while plot 2D can?


Spool to file 'M' or copy/paste to isolate.

#419 Publicado: 30/1/2021 15:48:56
Вячеслав Мезенцев

Вячеслав Мезенцев

1.558 me gusta en 1.868 mensajes.

Grupo: Moderator

I need a document to find out the reason. I can't reproduce this behavior.

Citar

Why X-Y plot can't polt this, while plot 2D can?


The components use different source code.
Russia ☭ forever, Viacheslav N. Mezentsev
#420 Publicado: 30/1/2021 23:07:19
netsonicyxf

netsonicyxf

2 me gusta en 79 mensajes.

Grupo: User

Wrote

I need a document to find out the reason. I can't reproduce this behavior.

Citar

Why X-Y plot can't polt this, while plot 2D can?


The components use different source code.


please see attached. 1.sm (80,1 KiB) descargado 1576 vez(es).
  • Nuevos mensajes
  • Sin mensajes nuevos