ZedGraph Region - Extends SMath Studio with a ZedGraph Region. - Messages
#81 Posted: 10/11/2023 1:06:41 PM

WroteUpdated. Experimental build. Be careful with this. You need to update X-Y Plot first.
Thanks for this handy information.
How can it be set properties when I have two or more plots in the same graph? Specifically, I need to set the properties via setprop() function, such as the first plot being plotted as a line (as default) and the second one being plotted with red circles.
Thanks in advance.
1 users liked this post
Andreas Hildebrandt 10/16/2025 9:30:17 AM
#82 Posted: 10/11/2023 2:00:53 PM
WroteHow can it be set properties when I have two or more plots in the same graph?
Viacheslav mentioned this 2 years ago.
ZedGraph, XYPlot, Mapple Plot uses setprop().
Apparently, it is not possible at the moment.
Regards
https://en.smath.com/forum/yaf_postsm75628_X-Y-Plot-Region.aspx#post75628
1 users liked this post
Oscar Campo 10/11/2023 2:18:00 PM
#83 Posted: 9/6/2025 3:12:59 AM
Hello~
Excuse me, Could anyone teach me how to add text in the graph pane? [1 1 "Text" 8 "black"] did not work in zedgraph. Thank you very much.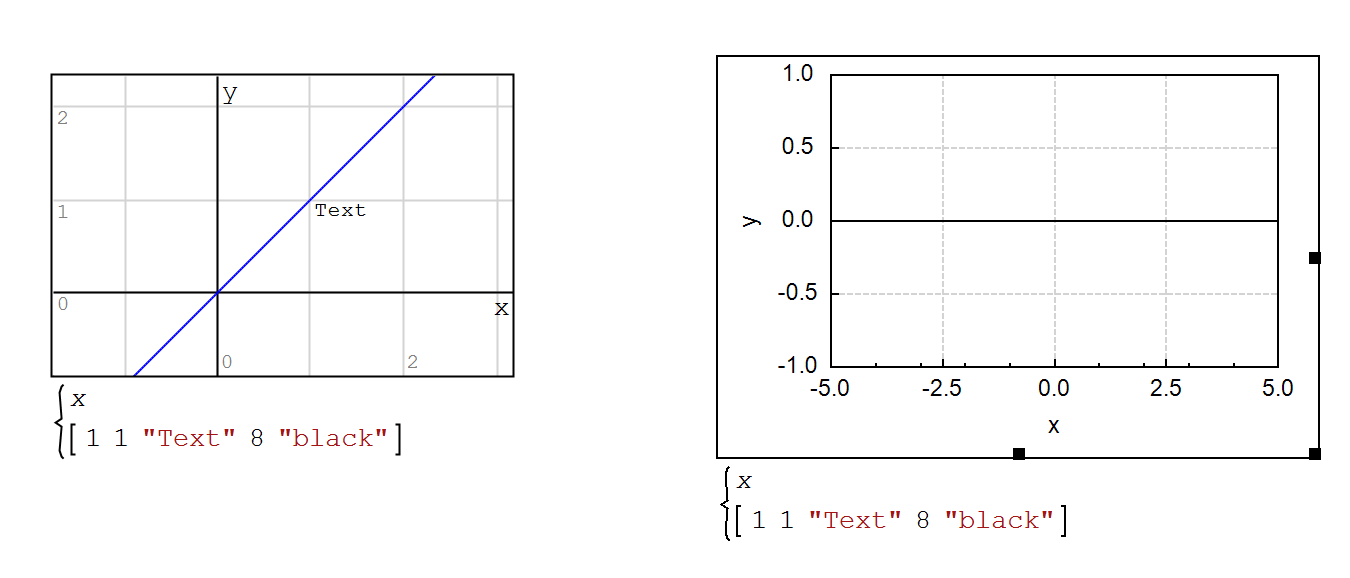
Excuse me, Could anyone teach me how to add text in the graph pane? [1 1 "Text" 8 "black"] did not work in zedgraph. Thank you very much.
#84 Posted: 9/6/2025 10:25:43 AM

It doesn't work because it's not implemented due to limited human resources. The component itself allows adding text, but there's no one to add the implementation of this feature.
Russia ☭ forever, Viacheslav N. Mezentsev
#85 Posted: 9/6/2025 5:46:07 PM
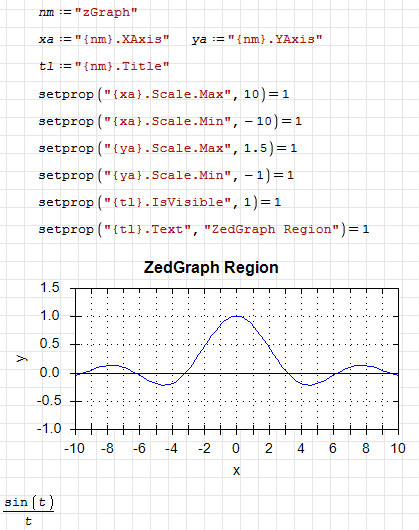
Hi. You can try this.
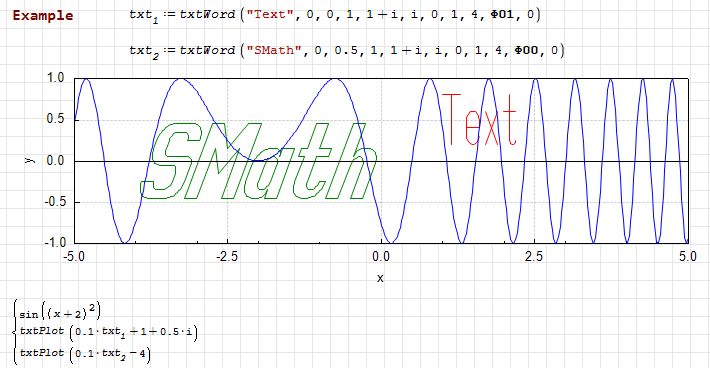
DrawingTextZedGraph.sm (466.87 KiB) downloaded 897 time(s).
Best regards.
Alvaro.
DrawingTextZedGraph.sm (466.87 KiB) downloaded 897 time(s).
Best regards.
Alvaro.
8 users liked this post
Andreas Hildebrandt 10/16/2025 9:30:33 AM, Oscar Campo 9/7/2025 10:09:48 AM, Вячеслав Мезенцев 9/6/2025 11:24:41 PM, liwenbus 9/7/2025 8:28:55 AM, francesco rapuano 9/7/2025 10:26:46 AM, NDTM Amarasekera 9/7/2025 2:06:41 PM, sergio 9/7/2025 4:22:26 PM, ioan92 9/8/2025 10:45:43 AM
#86 Posted: 9/7/2025 8:29:54 AM
It works! Thank you so much!
#87 Posted: 3/7/2026 1:30:54 PM
What's the differencr between X-Y plot and Zedgraph?
#88 Posted: 3/7/2026 1:38:07 PM
This plugin is more complex. It's based on a freely distributed component whose source code has been adapted for the program. It has fewer features than XY Plot; for example, you can't set any component properties from a document.
Once the codebase is migrated to Git, perhaps someone will want to modernize the plugin.
Once the codebase is migrated to Git, perhaps someone will want to modernize the plugin.
Edited 3/7/2026 1:42:25 PM
Russia ☭ forever, Viacheslav N. Mezentsev
1 users liked this post
netsonicyxf 3/8/2026 1:40:58 AM
#89 Posted: 3/8/2026 2:11:34 PM
Zedgraph can display logarithmic axes, X-Y plot can't (unfortunately). Also I like X-Y plot more, because it does not expose that many settings to the user. Also, X-Y plot has animation feature (didn't try with Zedgraph)
Technische Mechanik mit SMath Studio: https://link.springer.com/book/10.1007/978-3-658-50592-9
- New Posts
- No New Posts